HOT TOPICS LIST
- MACD
- Fibonacci
- RSI
- Gann
- ADXR
- Stochastics
- Volume
- Triangles
- Futures
- Cycles
- Volatility
- ZIGZAG
- MESA
- Retracement
- Aroon
INDICATORS LIST
LIST OF TOPICS
PRINT THIS ARTICLE
by Andrew Hetherington
The last time I wrote on this equity it had a very nice head and shoulders bottom reversal pattern. I was anticipating it to go higher over the long-term, but. . . things change. The time to sell long positions was when the long-term trendline was broken on February 23, 2004 in the $23.00 area.
Position: N/A
Andrew Hetherington
Classic Dow Theorist who trades as a pure technician, using pattern recognition.
PRINT THIS ARTICLE
CHART ANALYSIS
What Happened To Hewlett-Packard?
08/16/04 08:55:12 AMby Andrew Hetherington
The last time I wrote on this equity it had a very nice head and shoulders bottom reversal pattern. I was anticipating it to go higher over the long-term, but. . . things change. The time to sell long positions was when the long-term trendline was broken on February 23, 2004 in the $23.00 area.
Position: N/A
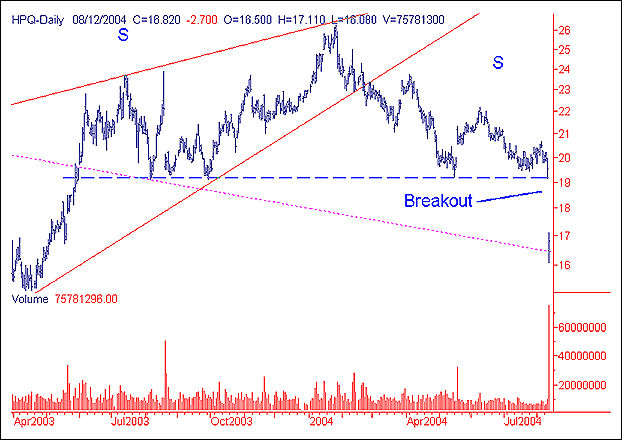
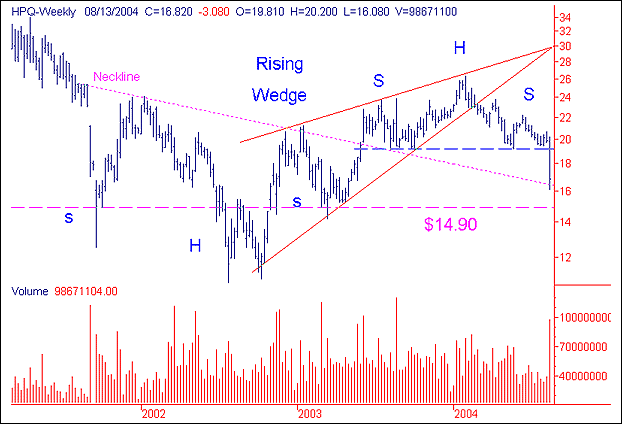
 Figure 1: 14-month daily chart of Hewlett Packard. Currently, Hewlett-Packard (HPQ) has a 14-month head and shoulders top pattern with near perfect volume on the creation of the pattern. The breakout was on August 12, in the $19.00 area, but anticipating this drop was evident when the third fan line was broken on July 6 in the $20.00 area. The usual pullback to the fan line occurred on August 5 in the $20.50 area. This was the ideal time to take a short position. Naturally, if you were short on this equity and it had a hard drop like today then you would cover your short at a nice profit in only a few days. A 20% profit in seven days is substantial and should not be passed up. Knowing when to lock in profits is an important detail that few ever master. |

|
| Figure 2: Weekly chart of HPQ. |
| Graphic provided by: SuperCharts. |
| |
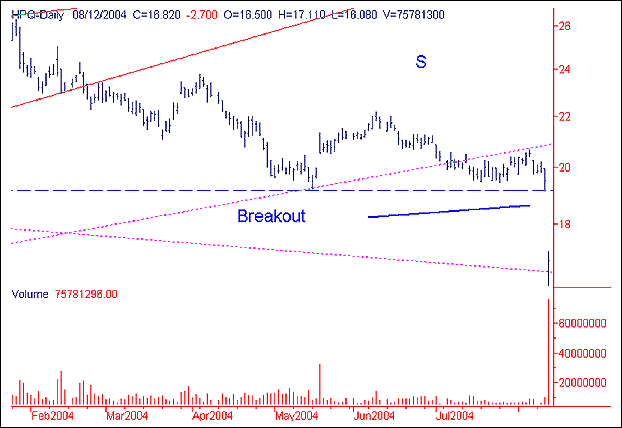
The next move to anticipate is another pullback to the neckline in the $19.00 area. This will be another opportunity for the nimble trader to trade it short once again. Naturally, if you take a short position and it goes above $20.00 then you should take a small loss and look for other options. The initial support of $16.00 held strong on today's drop but I anticipate it to move lower after the pullback towards the next support of $14.90. This would be a $4.00 profit on any short position in the $19.00 area and a second 20% profit. The second drop I am anticipating will not have the same ferociousness. It will be a slower grind down, meaning a trader needs to be patient and watch their lines.  Figure 3: Daily chart of HPQ. |
Classic Dow Theorist who trades as a pure technician, using pattern recognition.
| Toronto, Canada |
Click here for more information about our publications!
Comments
Date: 08/16/04Rank: 3Comment: Slight disagreement. That was a breakaway or runaway gap which tend to not be filled for a long time and provide a resistance area. I do not expect it to fill the gap like you do. I also have a problem with your target. Using the head shoulder method 26-19 subtracted from the neckline gives a 12 target area. Once it has been determined that this gap will not be filled its a great short for a trip down to 12.

Request Information From Our Sponsors
- StockCharts.com, Inc.
- Candle Patterns
- Candlestick Charting Explained
- Intermarket Technical Analysis
- John Murphy on Chart Analysis
- John Murphy's Chart Pattern Recognition
- John Murphy's Market Message
- MurphyExplainsMarketAnalysis-Intermarket Analysis
- MurphyExplainsMarketAnalysis-Visual Analysis
- StockCharts.com
- Technical Analysis of the Financial Markets
- The Visual Investor
- VectorVest, Inc.
- Executive Premier Workshop
- One-Day Options Course
- OptionsPro
- Retirement Income Workshop
- Sure-Fire Trading Systems (VectorVest, Inc.)
- Trading as a Business Workshop
- VectorVest 7 EOD
- VectorVest 7 RealTime/IntraDay
- VectorVest AutoTester
- VectorVest Educational Services
- VectorVest OnLine
- VectorVest Options Analyzer
- VectorVest ProGraphics v6.0
- VectorVest ProTrader 7
- VectorVest RealTime Derby Tool
- VectorVest Simulator
- VectorVest Variator
- VectorVest Watchdog
