HOT TOPICS LIST
- MACD
- Fibonacci
- RSI
- Gann
- ADXR
- Stochastics
- Volume
- Triangles
- Futures
- Cycles
- Volatility
- ZIGZAG
- MESA
- Retracement
- Aroon
INDICATORS LIST
LIST OF TOPICS
PRINT THIS ARTICLE
by Andrew Hetherington
Honeywell (HON) is definitely on the move higher, but the question is when to jump into a long position while the general market conditions are short. Examining the monthly, weekly and daily charts will help you make a better decision.
Position: N/A
Andrew Hetherington
Classic Dow Theorist who trades as a pure technician, using pattern recognition.
PRINT THIS ARTICLE
HEAD & SHOULDERS
Honeywell Is A Diamond In The Rough!
08/13/04 10:29:22 AMby Andrew Hetherington
Honeywell (HON) is definitely on the move higher, but the question is when to jump into a long position while the general market conditions are short. Examining the monthly, weekly and daily charts will help you make a better decision.
Position: N/A

|
| Graphic provided by: SuperCharts. |
| |
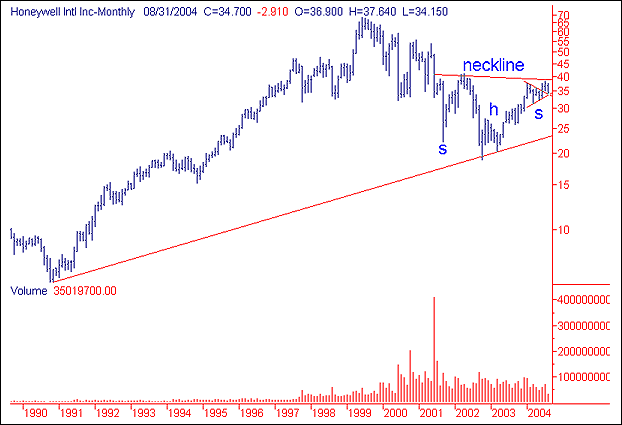
| The monthly chart shows a very long-term uptrend that will remain intact until the $23.00 line is breached. The volume is not clearly defined on this 4-year head and shoulders bottom reversal. Often, on a pattern of this duration, the volume is murky and this is not the pattern to place your bets on. Although this pattern exists, you would be taking you chances on the 8-month symmetrical triangle within the 4-year head and shoulders pattern. I much prefer larger patterns compared to smaller ones. However, this larger one is not supplying the power that the triangle will need to move upwards. If the volume on the large head and shoulders pattern were increasing throughout the creation of the pattern then I would anticipate this to be a very powerful upmove. As it stands, I would anticipate a modest move higher. |
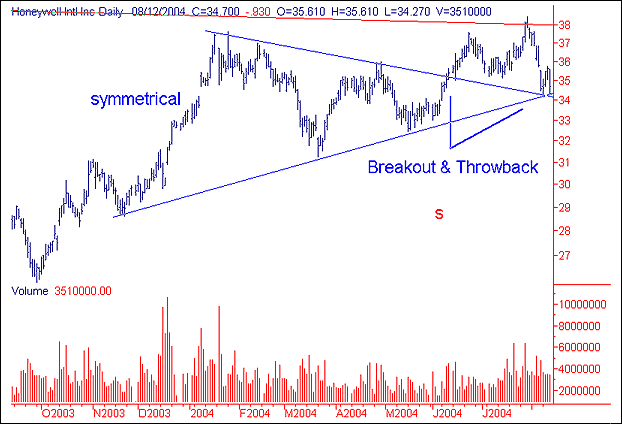
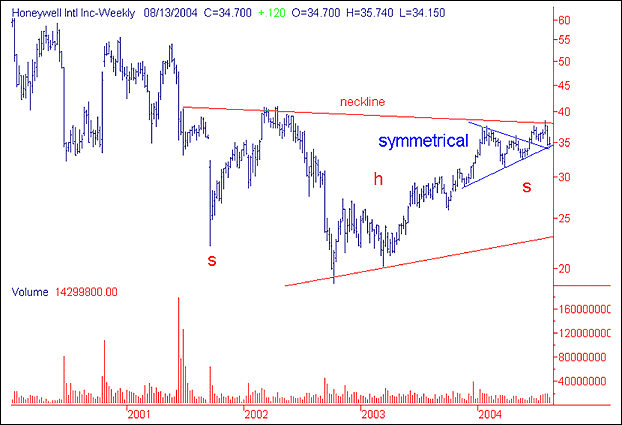
  However Honeywell's daily and weekly charts show perfect volume on the creation of the triangle. The diminished volume from the left to the right along with an increase in activity on the breakout bode well for an upmove. This equity is currently in the cradle of the triangle and this is the optimum time to go long. This is a tricky situation playing against the general trend; however, a long position in the $34.50 - $35.00 area should be handsomely rewarded down the road. If the general market continues below the 9600 supports, which I doubt, then this equity will be dragged below our bailout line of $34.00. |
| The initial target is for $41.00 and eventually $45.00. Naturally, it will go much higher over the long-term but this would be a good resistance area to lock in any profits. |
Classic Dow Theorist who trades as a pure technician, using pattern recognition.
| Toronto, Canada |
Click here for more information about our publications!
Comments
Date: 08/17/04Rank: 3Comment:

Request Information From Our Sponsors
- StockCharts.com, Inc.
- Candle Patterns
- Candlestick Charting Explained
- Intermarket Technical Analysis
- John Murphy on Chart Analysis
- John Murphy's Chart Pattern Recognition
- John Murphy's Market Message
- MurphyExplainsMarketAnalysis-Intermarket Analysis
- MurphyExplainsMarketAnalysis-Visual Analysis
- StockCharts.com
- Technical Analysis of the Financial Markets
- The Visual Investor
- VectorVest, Inc.
- Executive Premier Workshop
- One-Day Options Course
- OptionsPro
- Retirement Income Workshop
- Sure-Fire Trading Systems (VectorVest, Inc.)
- Trading as a Business Workshop
- VectorVest 7 EOD
- VectorVest 7 RealTime/IntraDay
- VectorVest AutoTester
- VectorVest Educational Services
- VectorVest OnLine
- VectorVest Options Analyzer
- VectorVest ProGraphics v6.0
- VectorVest ProTrader 7
- VectorVest RealTime Derby Tool
- VectorVest Simulator
- VectorVest Variator
- VectorVest Watchdog
