HOT TOPICS LIST
- MACD
- Fibonacci
- RSI
- Gann
- ADXR
- Stochastics
- Volume
- Triangles
- Futures
- Cycles
- Volatility
- ZIGZAG
- MESA
- Retracement
- Aroon
INDICATORS LIST
LIST OF TOPICS
PRINT THIS ARTICLE
by Andrew Hetherington
A head and shoulders points to downside for Lucent Technologies.
Position: N/A
Andrew Hetherington
Classic Dow Theorist who trades as a pure technician, using pattern recognition.
PRINT THIS ARTICLE
CHART ANALYSIS
Lucent Technologies Making A Slow Move Down
08/12/04 04:14:01 PMby Andrew Hetherington
A head and shoulders points to downside for Lucent Technologies.
Position: N/A

|
| Figure 1: Weekly chart of Lucent. |
| Graphic provided by: SuperCharts. |
| |
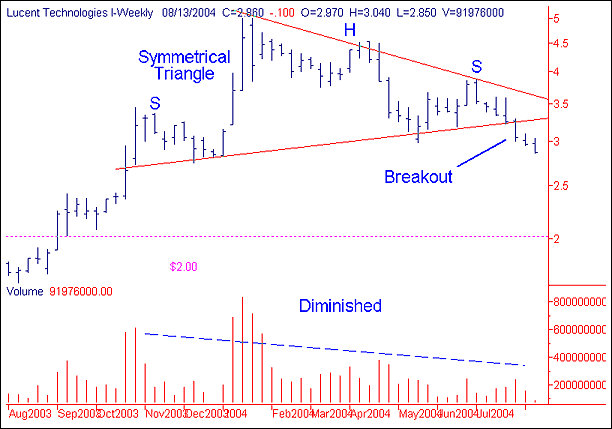
| The weekly chart for Lucent (LU) shows an 11-month head and shoulders top. The volume on this pattern is near perfect and the shoulders are symmetrical. My last writing on this chart ("What's Up With Lucent?" Traders.com Advantage, July 14, 2003) was to lock it away for the grandchildren when it was just under $2.00. It went as high as $5.00 and eventually broke the long-term uptrend on April 20, 2004 in the $4.20 area. On this day it had a magnificent one-day reversal with 182 million shares traded. This was the warning of ID (impending doom). The time to bail out was when prices broke below this line. It was no coincidence that the third fan line was broken on the same day of ID. Long and short-term holders should take heed when this fan line is broken. |
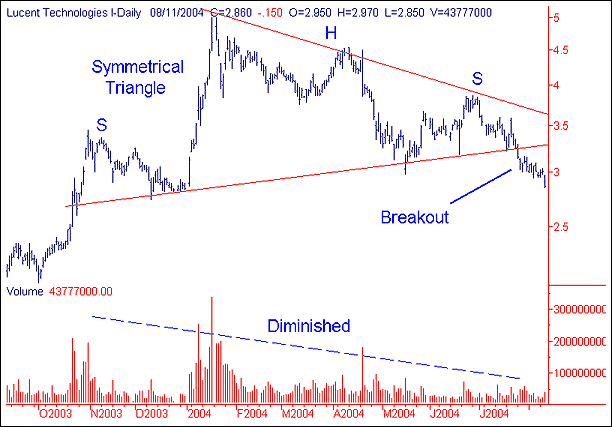
 Figure 2: Daily chart of Lucent. On the daily chart the breakout is on increased volume on the way down. The usual hesitation ensues in the $3.00 area prior to the inevitable down move to fulfill the pattern's strength. There will be support at the $2.75 area but this equity should worm its way lower toward the $2.00 support or just slightly higher. This support area is where I would choose to buy long once again. There will be plenty of accumulation in this area once again thereby making it a safer trade in the long-term. However, down is the current trend. |
Classic Dow Theorist who trades as a pure technician, using pattern recognition.
| Toronto, Canada |
Click here for more information about our publications!
Comments
Date: 08/12/04Rank: 5Comment:

Request Information From Our Sponsors
- StockCharts.com, Inc.
- Candle Patterns
- Candlestick Charting Explained
- Intermarket Technical Analysis
- John Murphy on Chart Analysis
- John Murphy's Chart Pattern Recognition
- John Murphy's Market Message
- MurphyExplainsMarketAnalysis-Intermarket Analysis
- MurphyExplainsMarketAnalysis-Visual Analysis
- StockCharts.com
- Technical Analysis of the Financial Markets
- The Visual Investor
- VectorVest, Inc.
- Executive Premier Workshop
- One-Day Options Course
- OptionsPro
- Retirement Income Workshop
- Sure-Fire Trading Systems (VectorVest, Inc.)
- Trading as a Business Workshop
- VectorVest 7 EOD
- VectorVest 7 RealTime/IntraDay
- VectorVest AutoTester
- VectorVest Educational Services
- VectorVest OnLine
- VectorVest Options Analyzer
- VectorVest ProGraphics v6.0
- VectorVest ProTrader 7
- VectorVest RealTime Derby Tool
- VectorVest Simulator
- VectorVest Variator
- VectorVest Watchdog
