

HOT TOPICS LIST
- MACD
- Fibonacci
- RSI
- Gann
- ADXR
- Stochastics
- Volume
- Triangles
- Futures
- Cycles
- Volatility
- ZIGZAG
- MESA
- Retracement
- Aroon
INDICATORS LIST
LIST OF TOPICS
PRINT THIS ARTICLE
by Arthur Hill
Despite weakness in French and German stocks, the Belgian stocks are finding a bid as the Bel-20 breaks symmetrical triangle resistance.
Position: Buy
Arthur Hill
Arthur Hill is currently editor of TDTrader.com, a website specializing in trading strategies, sector/industry specific breadth stats and overall technical analysis. He passed the Society of Technical Analysts (STA London) diploma exam with distinction is a Certified Financial Technician (CFTe). Prior to TD Trader, he was the Chief Technical Analyst for Stockcharts.com and the main contributor to the ChartSchool.
PRINT THIS ARTICLE
TRIANGLES
Bel-20 Bucks The Trend
08/05/04 09:08:24 AMby Arthur Hill
Despite weakness in French and German stocks, the Belgian stocks are finding a bid as the Bel-20 breaks symmetrical triangle resistance.
Position: Buy
| The charts for the German DAX and French CAC 40 look a lot like the S&P 500 chart in the U.S. All three have been in trading ranges over the last few months and recently tested their May lows. The patterns looks like large symmetrical triangles and a move below the July low would be most bearish. As long as these triangles hold, and their range continues to tighten, the outlook is neutral. |
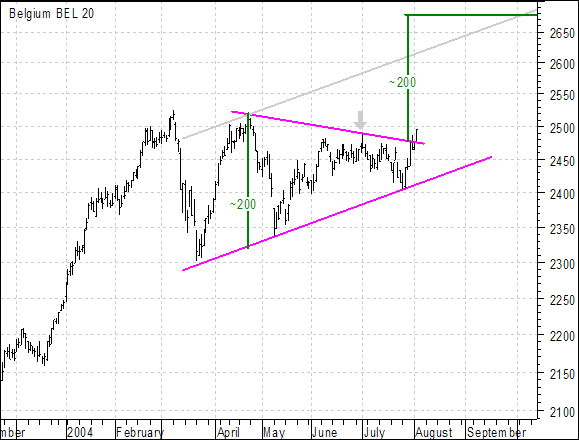
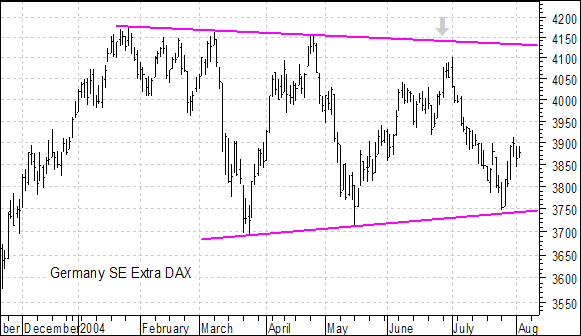 Figure 1: Chart of German DAX. 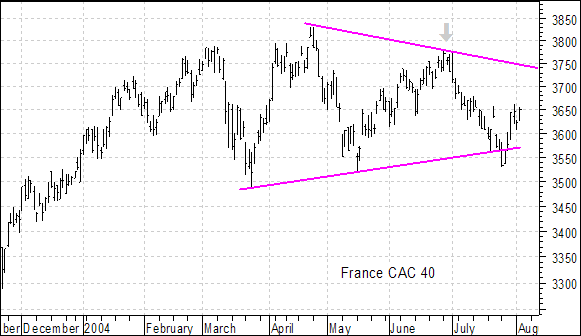 Figure 2: Chart of French CAC. The chart for the Bel-20 (Belgium) paints a more bullish picture though. While the DAX and CAC 40 traded down to their May lows, the Bel-20 held well above its May low and recently broke above its May high (gray arrow). The Bel-20 shows good relative strength (relative to both Europe and the U.S.) and this could foreshadow further strength in the index. |
|
| Figure 3: Chart of Bel-20. |
| Graphic provided by: MetaStock. |
| |
| Turning to the actual price chart, the pattern at work looks like a symmetrical triangle. These are typically neutral patterns dependent on a breakout for a directional bias. The trendline break is still relatively young, but the three month high bodes well and should be considered bullish as long as the July low holds (2400). |
| There are two methods to project an upside target. First, a trendline can be drawn parallel to the lower trendline and extended into the future. This (gray) trendline projects an advance above 2600 and to around 2680 over the next few months. Second, the width of the pattern can be added to the breakout for a confirming target around 2680 (2525 - 2325 = 200, 2475 + 200 = 2675). |
Arthur Hill is currently editor of TDTrader.com, a website specializing in trading strategies, sector/industry specific breadth stats and overall technical analysis. He passed the Society of Technical Analysts (STA London) diploma exam with distinction is a Certified Financial Technician (CFTe). Prior to TD Trader, he was the Chief Technical Analyst for Stockcharts.com and the main contributor to the ChartSchool.
| Title: | Editor |
| Company: | TDTrader.com |
| Address: | Willem Geetsstraat 17 |
| Mechelen, B2800 | |
| Phone # for sales: | 3215345465 |
| Website: | www.tdtrader.com |
| E-mail address: | arthurh@tdtrader.com |
Traders' Resource Links | |
| TDTrader.com has not added any product or service information to TRADERS' RESOURCE. | |
Click here for more information about our publications!
PRINT THIS ARTICLE

Request Information From Our Sponsors
- StockCharts.com, Inc.
- Candle Patterns
- Candlestick Charting Explained
- Intermarket Technical Analysis
- John Murphy on Chart Analysis
- John Murphy's Chart Pattern Recognition
- John Murphy's Market Message
- MurphyExplainsMarketAnalysis-Intermarket Analysis
- MurphyExplainsMarketAnalysis-Visual Analysis
- StockCharts.com
- Technical Analysis of the Financial Markets
- The Visual Investor
- VectorVest, Inc.
- Executive Premier Workshop
- One-Day Options Course
- OptionsPro
- Retirement Income Workshop
- Sure-Fire Trading Systems (VectorVest, Inc.)
- Trading as a Business Workshop
- VectorVest 7 EOD
- VectorVest 7 RealTime/IntraDay
- VectorVest AutoTester
- VectorVest Educational Services
- VectorVest OnLine
- VectorVest Options Analyzer
- VectorVest ProGraphics v6.0
- VectorVest ProTrader 7
- VectorVest RealTime Derby Tool
- VectorVest Simulator
- VectorVest Variator
- VectorVest Watchdog