HOT TOPICS LIST
- MACD
- Fibonacci
- RSI
- Gann
- ADXR
- Stochastics
- Volume
- Triangles
- Futures
- Cycles
- Volatility
- ZIGZAG
- MESA
- Retracement
- Aroon
INDICATORS LIST
LIST OF TOPICS
PRINT THIS ARTICLE
by Jayanthi Gopalakrishnan
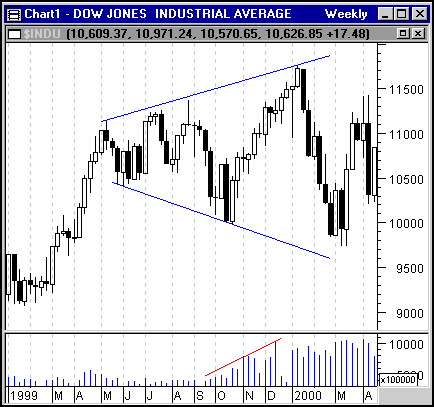
Broadening formations, also known as broadening triangles, are defined as a series of higher highs combined with lower lows. Trading volume tends to expand during the widening phase, and signal a breakdown of the current pattern.
Position: N/A
Jayanthi Gopalakrishnan
PRINT THIS ARTICLE
BROAD FORMATION
Broadening Formations
05/22/00 05:43:09 PMby Jayanthi Gopalakrishnan
Broadening formations, also known as broadening triangles, are defined as a series of higher highs combined with lower lows. Trading volume tends to expand during the widening phase, and signal a breakdown of the current pattern.
Position: N/A
| The broadening formation can be either a consolidation (correction period), or a complete reversal. You will not come across broadening formations often, but when you do they signify important support and resistance levels. The upper trendline acts as a resistance level while the lower trendline acts as a support level. Generally when you see this formation starting, extend both trendlines to determine which way prices will move. A break in any of the trendlines would indicate an entry point for a trade. |
| The simplest method to utilize broading formations is to go long when prices turn away from the support line. Always place a stop 1/8 to 1/4 point above this line. You can go one step further by placing a price target for exiting your position. Take the difference between the high and low point and add this difference to either the high or low. |

|
| The DJIA weekly chart showing a broadening top formation. |
| Graphic provided by: MetaStock. |
| |
| Title: | Editor |
| Company: | Technical Analysis of Stocks & Commodities |
| Address: | 4757 California Ave SW |
| Seattle, WA 98116 | |
| Website: | Traders.com |
| E-mail address: | Jayanthi@traders.com |
Traders' Resource Links | |
| Charting the Stock Market: The Wyckoff Method -- Books | |
| Working-Money.com -- Online Trading Services | |
| Traders.com Advantage -- Online Trading Services | |
| Technical Analysis of Stocks & Commodities -- Publications and Newsletters | |
| Working Money, at Working-Money.com -- Publications and Newsletters | |
| Traders.com Advantage -- Publications and Newsletters | |
| Professional Traders Starter Kit -- Software | |
Click here for more information about our publications!
Comments
Date: / /Rank: 1Comment:

|

Request Information From Our Sponsors
- StockCharts.com, Inc.
- Candle Patterns
- Candlestick Charting Explained
- Intermarket Technical Analysis
- John Murphy on Chart Analysis
- John Murphy's Chart Pattern Recognition
- John Murphy's Market Message
- MurphyExplainsMarketAnalysis-Intermarket Analysis
- MurphyExplainsMarketAnalysis-Visual Analysis
- StockCharts.com
- Technical Analysis of the Financial Markets
- The Visual Investor
- VectorVest, Inc.
- Executive Premier Workshop
- One-Day Options Course
- OptionsPro
- Retirement Income Workshop
- Sure-Fire Trading Systems (VectorVest, Inc.)
- Trading as a Business Workshop
- VectorVest 7 EOD
- VectorVest 7 RealTime/IntraDay
- VectorVest AutoTester
- VectorVest Educational Services
- VectorVest OnLine
- VectorVest Options Analyzer
- VectorVest ProGraphics v6.0
- VectorVest ProTrader 7
- VectorVest RealTime Derby Tool
- VectorVest Simulator
- VectorVest Variator
- VectorVest Watchdog
