

HOT TOPICS LIST
- MACD
- Fibonacci
- RSI
- Gann
- ADXR
- Stochastics
- Volume
- Triangles
- Futures
- Cycles
- Volatility
- ZIGZAG
- MESA
- Retracement
- Aroon
INDICATORS LIST
LIST OF TOPICS
PRINT THIS ARTICLE
by Arthur Hill
My previous articles on the Dow Jones Airline Index were bullish, but a recent failure and steep decline suggest something is amiss and a reassessment is in order.
Position: N/A
Arthur Hill
Arthur Hill is currently editor of TDTrader.com, a website specializing in trading strategies, sector/industry specific breadth stats and overall technical analysis. He passed the Society of Technical Analysts (STA London) diploma exam with distinction is a Certified Financial Technician (CFTe). Prior to TD Trader, he was the Chief Technical Analyst for Stockcharts.com and the main contributor to the ChartSchool.
PRINT THIS ARTICLE
CHART ANALYSIS
Airlines Get Grounded
07/20/04 09:36:10 AMby Arthur Hill
My previous articles on the Dow Jones Airline Index were bullish, but a recent failure and steep decline suggest something is amiss and a reassessment is in order.
Position: N/A
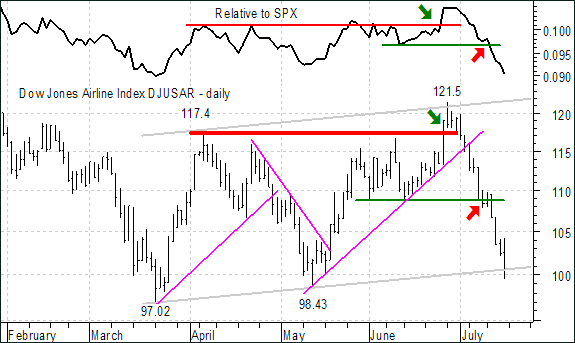
| In April, I proposed that the index had formed a large falling price channel and the normal retracement or correction that followed would soon give way to a resumption of the previous uptrend. In May, the index was outperforming the S&P 500 and poised to break above its April high to confirm a double bottom as well. The breakout did indeed occur in late June, but failed to hold and the index is now trading back near its May lows. This is not how a bullish breakout should act and it is back to the old charting program for some answers. |
|
| Figure 1: Dow Jones Airline Index - Daily. |
| Graphic provided by: MetaStock. |
| |
| First, let's look at the failure on the daily chart. The index broke above resistance with a strong move on 25-June (green arrow). This coincided with a resistance breakout in the price relative (DJUSAR relative to SPX) and all systems were a go in late June. Then came July and the breakout failed to hold. This was not a big deal until the index broke below the June low (red arrow) and retreated all the way back to the May lows! The price relative did the same as the index went from outperforming to underperforming in three short weeks. Of possible coincidence, West Texas Intermediate Crude moved from the mid 30s back above 40 during this time frame. |
 Figure 2: Weekly chart of DJUSAR. Turning to the weekly chart, the pattern at work now looks like a rising flag or consolidation (blue trendlines). The rising nature of the pattern makes it a classic bearish consolidation or continuation pattern. A move below the lower trendline would be negative and a break below the May low would open the door to a continuation of the prior decline (156.54 to 97.02). Also notice that MACD is still below the zero line, rolling over and a signal line crossover would add another bearish signal. |
| There is still some support (hope) around 97-100, but the recent failure and depth of the decline suggest something is wrong. A move below the May low at 98.43 would be one nail and further weakness below the March low at 97.02 would be the final nail in the Airlines' coffin. |
Arthur Hill is currently editor of TDTrader.com, a website specializing in trading strategies, sector/industry specific breadth stats and overall technical analysis. He passed the Society of Technical Analysts (STA London) diploma exam with distinction is a Certified Financial Technician (CFTe). Prior to TD Trader, he was the Chief Technical Analyst for Stockcharts.com and the main contributor to the ChartSchool.
| Title: | Editor |
| Company: | TDTrader.com |
| Address: | Willem Geetsstraat 17 |
| Mechelen, B2800 | |
| Phone # for sales: | 3215345465 |
| Website: | www.tdtrader.com |
| E-mail address: | arthurh@tdtrader.com |
Traders' Resource Links | |
| TDTrader.com has not added any product or service information to TRADERS' RESOURCE. | |
Click here for more information about our publications!
PRINT THIS ARTICLE

Request Information From Our Sponsors
- StockCharts.com, Inc.
- Candle Patterns
- Candlestick Charting Explained
- Intermarket Technical Analysis
- John Murphy on Chart Analysis
- John Murphy's Chart Pattern Recognition
- John Murphy's Market Message
- MurphyExplainsMarketAnalysis-Intermarket Analysis
- MurphyExplainsMarketAnalysis-Visual Analysis
- StockCharts.com
- Technical Analysis of the Financial Markets
- The Visual Investor
- VectorVest, Inc.
- Executive Premier Workshop
- One-Day Options Course
- OptionsPro
- Retirement Income Workshop
- Sure-Fire Trading Systems (VectorVest, Inc.)
- Trading as a Business Workshop
- VectorVest 7 EOD
- VectorVest 7 RealTime/IntraDay
- VectorVest AutoTester
- VectorVest Educational Services
- VectorVest OnLine
- VectorVest Options Analyzer
- VectorVest ProGraphics v6.0
- VectorVest ProTrader 7
- VectorVest RealTime Derby Tool
- VectorVest Simulator
- VectorVest Variator
- VectorVest Watchdog