HOT TOPICS LIST
- MACD
- Fibonacci
- RSI
- Gann
- ADXR
- Stochastics
- Volume
- Triangles
- Futures
- Cycles
- Volatility
- ZIGZAG
- MESA
- Retracement
- Aroon
INDICATORS LIST
LIST OF TOPICS
PRINT THIS ARTICLE
by Koos van der Merwe
The market seems to be moving sideways in the summer doldrums. CNBC presenters keep talking about technology stocks bringing the market down. Yet Cisco...hmmm... what are you telling us?
Position: Accumulate
Koos van der Merwe
Has been a technical analyst since 1969, and has worked as a futures and options trader with First Financial Futures in Johannesburg, South Africa.
PRINT THIS ARTICLE
WEDGE FORMATIONS
CISCO SYSTEMS: Are You Telling Us Something?
07/16/04 08:55:36 AMby Koos van der Merwe
The market seems to be moving sideways in the summer doldrums. CNBC presenters keep talking about technology stocks bringing the market down. Yet Cisco...hmmm... what are you telling us?
Position: Accumulate
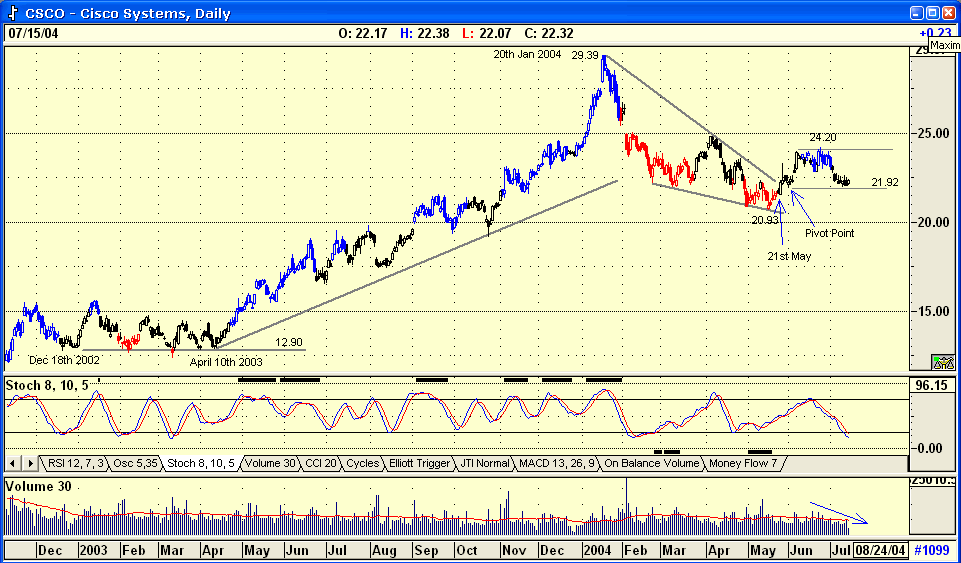
| The chart shows the price of Cisco moving upwards after a relatively flat period from December 2002 to April 2003. The price topped out on January 20th, 2004 at $29.39. From that date, it has been falling in what appears to be a wedge formation, breaking out of the formation on May 21st. |
| Now, by all accounts, Cisco should now rise to reach its target of $37.42. This target is determined by the following calculation: $29.39 - $12.90 = $16.49 + $20.93 = $37.42. What has happened so far is that the price rose to $24.20. Notice how the the stochastic oscillator touched its overbought levels at that price. After that prices fell back to find support at $21.92, a minor previous pivot point. This it did on declining volume, which really is a sign of strength. At the same time, the stochastic was at oversold levels, but a buy signal has not been given, yet. |

|
| Cisco Systems |
| Graphic provided by: AdvancedGET. |
| |
| What now? If that support level at $21.92 were to hold you could see a rise to test the resistance level at $24.20. If the price were to break above this level you could very well see Cisco trying to reach its target of $37.42. |
Has been a technical analyst since 1969, and has worked as a futures and options trader with First Financial Futures in Johannesburg, South Africa.
| Address: | 3256 West 24th Ave |
| Vancouver, BC | |
| Phone # for sales: | 6042634214 |
| E-mail address: | petroosp@gmail.com |
Click here for more information about our publications!
Comments
Date: 07/16/04Rank: 5Comment:

Request Information From Our Sponsors
- StockCharts.com, Inc.
- Candle Patterns
- Candlestick Charting Explained
- Intermarket Technical Analysis
- John Murphy on Chart Analysis
- John Murphy's Chart Pattern Recognition
- John Murphy's Market Message
- MurphyExplainsMarketAnalysis-Intermarket Analysis
- MurphyExplainsMarketAnalysis-Visual Analysis
- StockCharts.com
- Technical Analysis of the Financial Markets
- The Visual Investor
- VectorVest, Inc.
- Executive Premier Workshop
- One-Day Options Course
- OptionsPro
- Retirement Income Workshop
- Sure-Fire Trading Systems (VectorVest, Inc.)
- Trading as a Business Workshop
- VectorVest 7 EOD
- VectorVest 7 RealTime/IntraDay
- VectorVest AutoTester
- VectorVest Educational Services
- VectorVest OnLine
- VectorVest Options Analyzer
- VectorVest ProGraphics v6.0
- VectorVest ProTrader 7
- VectorVest RealTime Derby Tool
- VectorVest Simulator
- VectorVest Variator
- VectorVest Watchdog
