

HOT TOPICS LIST
- MACD
- Fibonacci
- RSI
- Gann
- ADXR
- Stochastics
- Volume
- Triangles
- Futures
- Cycles
- Volatility
- ZIGZAG
- MESA
- Retracement
- Aroon
INDICATORS LIST
LIST OF TOPICS
PRINT THIS ARTICLE
by Arthur Hill
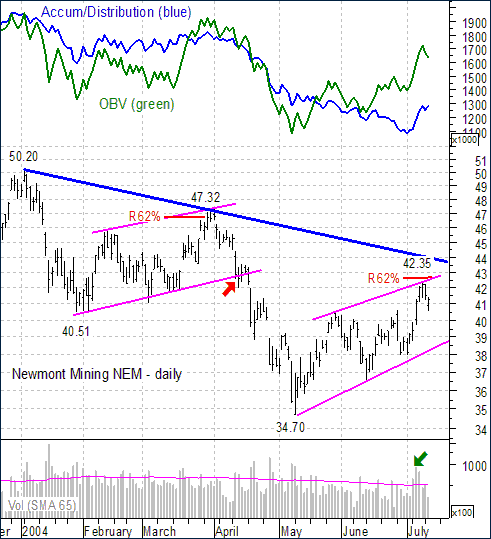
Here is Newmont Mining (NEM) with two volume indicators singing from different song books.
Position: Hold
Arthur Hill
Arthur Hill is currently editor of TDTrader.com, a website specializing in trading strategies, sector/industry specific breadth stats and overall technical analysis. He passed the Society of Technical Analysts (STA London) diploma exam with distinction is a Certified Financial Technician (CFTe). Prior to TD Trader, he was the Chief Technical Analyst for Stockcharts.com and the main contributor to the ChartSchool.
PRINT THIS ARTICLE
VOLUME
Volume Indicators Differ for Newmont
07/14/04 04:10:05 PMby Arthur Hill
Here is Newmont Mining (NEM) with two volume indicators singing from different song books.
Position: Hold
| Despite a moderate gain over the last two months, the accumulation distribution line has only recently started to participate and looks quite different than OBV. |
| Looking at the price action first, it is clear that NEM is entering and important resistance area. The stock retraced 62% of its prior decline (47.32 to 34.70) with a rising wedge advance to 42.35 and is trading just below the trendline extending down from 50.20. |
|
| Figure 1: Daily chart for Newmont Mining (NEM). |
| Graphic provided by: MetaStock. |
| |
| Both the retracement and pattern are typical for corrective advances. Notice that NEM formed a similar pattern and retracement in February and March as the stock also retraced 62% of its prior decline (50.20 to 40.51) with a rising price channel advance to 47.32. The lower trendline break (red arrow) signaled a continuation lower and foreshadowed a decline to 34.70. |
| Two key volume indicators offer different takes on the current advance. On Balance Volume (OBV) bottomed with the stock in May and moved to its highest level since mid April. However, the Accumulation Distribution Line only started to rise over the last six days and has been trending lower the last few months. |
| This non-confirmation by the Accumulation Distribution Line should be taken as a warning, especially with the stock trading at the 62% retracement mark and near the blue trendline extending down from 50.20. There was a surge in volume (green arrow) as the stock moved above its June high and perhaps the indicator will play a little catch-up. As long as the trendline extending up from 34.70 holds, the bulls get the benefit of the doubt. A move below the trendline (38) would confirm weakness in the Accumulation Distribution Line and signal a move into the low 30's for the stock. |
Arthur Hill is currently editor of TDTrader.com, a website specializing in trading strategies, sector/industry specific breadth stats and overall technical analysis. He passed the Society of Technical Analysts (STA London) diploma exam with distinction is a Certified Financial Technician (CFTe). Prior to TD Trader, he was the Chief Technical Analyst for Stockcharts.com and the main contributor to the ChartSchool.
| Title: | Editor |
| Company: | TDTrader.com |
| Address: | Willem Geetsstraat 17 |
| Mechelen, B2800 | |
| Phone # for sales: | 3215345465 |
| Website: | www.tdtrader.com |
| E-mail address: | arthurh@tdtrader.com |
Traders' Resource Links | |
| TDTrader.com has not added any product or service information to TRADERS' RESOURCE. | |
Click here for more information about our publications!
Comments

Request Information From Our Sponsors
- StockCharts.com, Inc.
- Candle Patterns
- Candlestick Charting Explained
- Intermarket Technical Analysis
- John Murphy on Chart Analysis
- John Murphy's Chart Pattern Recognition
- John Murphy's Market Message
- MurphyExplainsMarketAnalysis-Intermarket Analysis
- MurphyExplainsMarketAnalysis-Visual Analysis
- StockCharts.com
- Technical Analysis of the Financial Markets
- The Visual Investor
- VectorVest, Inc.
- Executive Premier Workshop
- One-Day Options Course
- OptionsPro
- Retirement Income Workshop
- Sure-Fire Trading Systems (VectorVest, Inc.)
- Trading as a Business Workshop
- VectorVest 7 EOD
- VectorVest 7 RealTime/IntraDay
- VectorVest AutoTester
- VectorVest Educational Services
- VectorVest OnLine
- VectorVest Options Analyzer
- VectorVest ProGraphics v6.0
- VectorVest ProTrader 7
- VectorVest RealTime Derby Tool
- VectorVest Simulator
- VectorVest Variator
- VectorVest Watchdog