HOT TOPICS LIST
- MACD
- Fibonacci
- RSI
- Gann
- ADXR
- Stochastics
- Volume
- Triangles
- Futures
- Cycles
- Volatility
- ZIGZAG
- MESA
- Retracement
- Aroon
INDICATORS LIST
LIST OF TOPICS
PRINT THIS ARTICLE
by Arthur Hill
Although relatively rare, the S&P SmallCap Index (SML) formed its second broadening formation in the last four years.
Position: Hold
Arthur Hill
Arthur Hill is currently editor of TDTrader.com, a website specializing in trading strategies, sector/industry specific breadth stats and overall technical analysis. He passed the Society of Technical Analysts (STA London) diploma exam with distinction is a Certified Financial Technician (CFTe). Prior to TD Trader, he was the Chief Technical Analyst for Stockcharts.com and the main contributor to the ChartSchool.
PRINT THIS ARTICLE
BROADENING FORMATION
Small Cap Index Forms Broadening Formation
07/08/04 08:15:05 AMby Arthur Hill
Although relatively rare, the S&P SmallCap Index (SML) formed its second broadening formation in the last four years.
Position: Hold
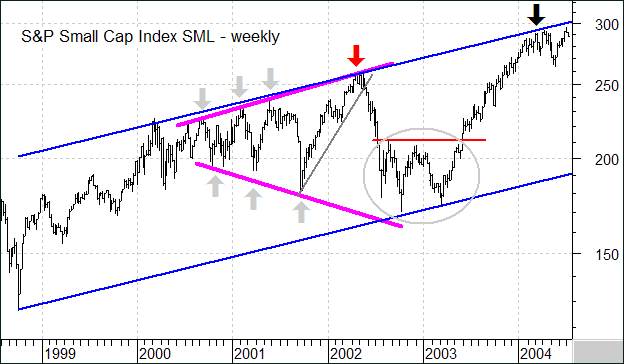
| On the weekly chart, SML formed a broadening formation that extended from June 2000 to May 2002 (magenta trendlines). Notice that the pattern looks like a megaphone as it traces out higher highs and lower lows (gray arrows). The reversal in May 2002 (red arrow) was quite quick and led to a sharp decline over the next few months. |

|
| Figure 1: Weekly chart for the S&P Small Cap Index. |
| Graphic provided by: MetaStock. |
| |
| The S&P SmallCap Index found support around 170 and formed a large base (gray oval). The subsequent breakout in May 2003 preceded an advance to new highs and the formation of a large rising price channel (blue trendlines). The lower trendline was drawn first and the upper trendline was then drawn parallel. Both have been touched at least three times and the index is currently trading near the upper boundary of the channel (black arrow). Further upside may be difficult. |
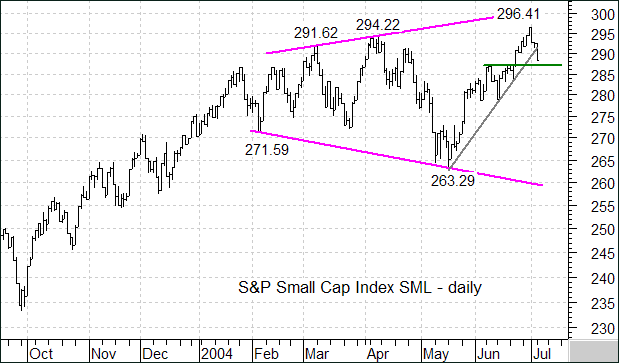
 Figure 2: Daily chart for SML. Turning to the daily chart, we can see the second and smaller broadening formation. The index forged higher highs in March, April and June. Combined with the lower lows in February and May, the pattern looks like another megaphone. These are volatile patterns that reflect a serious battle between bulls and bears. The bears were strong enough to forge lower lows, but the bulls were able to counter with higher highs. It makes for dangerous trading as new reaction highs are followed by new reaction lows. With the index at a new reaction high (296.41), the odds favor a reversal and move below 263.29 in the coming weeks. |
Arthur Hill is currently editor of TDTrader.com, a website specializing in trading strategies, sector/industry specific breadth stats and overall technical analysis. He passed the Society of Technical Analysts (STA London) diploma exam with distinction is a Certified Financial Technician (CFTe). Prior to TD Trader, he was the Chief Technical Analyst for Stockcharts.com and the main contributor to the ChartSchool.
| Title: | Editor |
| Company: | TDTrader.com |
| Address: | Willem Geetsstraat 17 |
| Mechelen, B2800 | |
| Phone # for sales: | 3215345465 |
| Website: | www.tdtrader.com |
| E-mail address: | arthurh@tdtrader.com |
Traders' Resource Links | |
| TDTrader.com has not added any product or service information to TRADERS' RESOURCE. | |
Click here for more information about our publications!
Comments
Date: 07/09/04Rank: 5Comment:
Date: 07/26/04Rank: 4Comment:

Request Information From Our Sponsors
- StockCharts.com, Inc.
- Candle Patterns
- Candlestick Charting Explained
- Intermarket Technical Analysis
- John Murphy on Chart Analysis
- John Murphy's Chart Pattern Recognition
- John Murphy's Market Message
- MurphyExplainsMarketAnalysis-Intermarket Analysis
- MurphyExplainsMarketAnalysis-Visual Analysis
- StockCharts.com
- Technical Analysis of the Financial Markets
- The Visual Investor
- VectorVest, Inc.
- Executive Premier Workshop
- One-Day Options Course
- OptionsPro
- Retirement Income Workshop
- Sure-Fire Trading Systems (VectorVest, Inc.)
- Trading as a Business Workshop
- VectorVest 7 EOD
- VectorVest 7 RealTime/IntraDay
- VectorVest AutoTester
- VectorVest Educational Services
- VectorVest OnLine
- VectorVest Options Analyzer
- VectorVest ProGraphics v6.0
- VectorVest ProTrader 7
- VectorVest RealTime Derby Tool
- VectorVest Simulator
- VectorVest Variator
- VectorVest Watchdog
