HOT TOPICS LIST
- MACD
- Fibonacci
- RSI
- Gann
- ADXR
- Stochastics
- Volume
- Triangles
- Futures
- Cycles
- Volatility
- ZIGZAG
- MESA
- Retracement
- Aroon
INDICATORS LIST
LIST OF TOPICS
PRINT THIS ARTICLE
by Arthur Hill
The Dow Jones Airline Index was profiled in late May ("Airlines Starting To Lead," Traders.com Advantage, May 28, 2004), showing good relative strength and a potential double bottom evolving. That double bottom has been confirmed and relative strength remains strong.
Position: Buy
Arthur Hill
Arthur Hill is currently editor of TDTrader.com, a website specializing in trading strategies, sector/industry specific breadth stats and overall technical analysis. He passed the Society of Technical Analysts (STA London) diploma exam with distinction is a Certified Financial Technician (CFTe). Prior to TD Trader, he was the Chief Technical Analyst for Stockcharts.com and the main contributor to the ChartSchool.
PRINT THIS ARTICLE
CHART ANALYSIS
Airlines Extend Their Lead
07/01/04 11:12:41 AMby Arthur Hill
The Dow Jones Airline Index was profiled in late May ("Airlines Starting To Lead," Traders.com Advantage, May 28, 2004), showing good relative strength and a potential double bottom evolving. That double bottom has been confirmed and relative strength remains strong.
Position: Buy
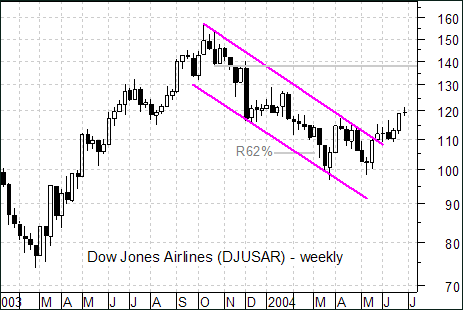
 Figure 1: Weekly chart of the DJUSAR. On the weekly chart, the Dow Jones Airline Index (DJUSAR) sports a very bullish pattern as well. The index retraced around 62% of its prior advance with a falling price channel. Even though there was an overshoot, both the pattern and the retracement are classic for a correction. The trendline break and recent higher high signal a continuation of the prior advance and project further strength above the October 2003 high. This would no doubt help the Dow Transports. |

|
| Figure 2: Daily chart of the DJUSAR. |
| Graphic provided by: MetaStock. |
| |
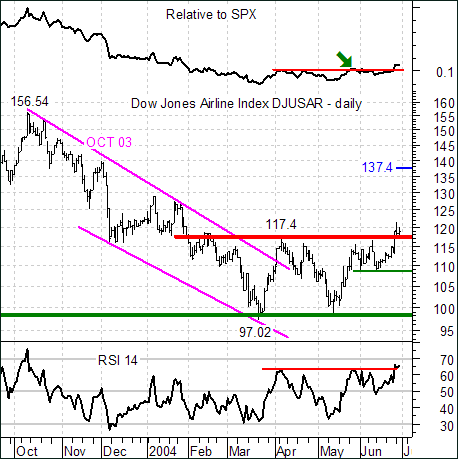
| Turning to the daily chart, we can see the double bottom and make an upside projection. The double bottom extends from 117.4 to 97.02 (20.38) and this amount can be added to the breakout to get an upside target of 137.38 (117.4 + 20.38 = 137.4). |
| The recent breakout at 117.4 was confirmed by further strength in the price relative. This price relative compares the strength of the DJUSAR to the S&P 500. The price relative rises when DJUSAR outperforms the S&P 500 and falls when it underperforms. There was a breakout attempt in late May (green arrow) and then a move above resistance in late June. This new high in the price relative shows that the group is leading the S&P 500. |
| RSI shows room for further upside as well. RSI broke above its May and April highs this month. In addition, the indicator is trading at its highest level since October when it exceeded 70 and became overbought. RSI currently has further room to run before reaching 70 and becoming overbought. |
Arthur Hill is currently editor of TDTrader.com, a website specializing in trading strategies, sector/industry specific breadth stats and overall technical analysis. He passed the Society of Technical Analysts (STA London) diploma exam with distinction is a Certified Financial Technician (CFTe). Prior to TD Trader, he was the Chief Technical Analyst for Stockcharts.com and the main contributor to the ChartSchool.
| Title: | Editor |
| Company: | TDTrader.com |
| Address: | Willem Geetsstraat 17 |
| Mechelen, B2800 | |
| Phone # for sales: | 3215345465 |
| Website: | www.tdtrader.com |
| E-mail address: | arthurh@tdtrader.com |
Traders' Resource Links | |
| TDTrader.com has not added any product or service information to TRADERS' RESOURCE. | |
Click here for more information about our publications!
PRINT THIS ARTICLE

Request Information From Our Sponsors
- StockCharts.com, Inc.
- Candle Patterns
- Candlestick Charting Explained
- Intermarket Technical Analysis
- John Murphy on Chart Analysis
- John Murphy's Chart Pattern Recognition
- John Murphy's Market Message
- MurphyExplainsMarketAnalysis-Intermarket Analysis
- MurphyExplainsMarketAnalysis-Visual Analysis
- StockCharts.com
- Technical Analysis of the Financial Markets
- The Visual Investor
- VectorVest, Inc.
- Executive Premier Workshop
- One-Day Options Course
- OptionsPro
- Retirement Income Workshop
- Sure-Fire Trading Systems (VectorVest, Inc.)
- Trading as a Business Workshop
- VectorVest 7 EOD
- VectorVest 7 RealTime/IntraDay
- VectorVest AutoTester
- VectorVest Educational Services
- VectorVest OnLine
- VectorVest Options Analyzer
- VectorVest ProGraphics v6.0
- VectorVest ProTrader 7
- VectorVest RealTime Derby Tool
- VectorVest Simulator
- VectorVest Variator
- VectorVest Watchdog
