HOT TOPICS LIST
- MACD
- Fibonacci
- RSI
- Gann
- ADXR
- Stochastics
- Volume
- Triangles
- Futures
- Cycles
- Volatility
- ZIGZAG
- MESA
- Retracement
- Aroon
INDICATORS LIST
LIST OF TOPICS
PRINT THIS ARTICLE
by Arthur Hill
Here is the Nikkei with trendline break and triple resistance threat.
Position: N/A
Arthur Hill
Arthur Hill is currently editor of TDTrader.com, a website specializing in trading strategies, sector/industry specific breadth stats and overall technical analysis. He passed the Society of Technical Analysts (STA London) diploma exam with distinction is a Certified Financial Technician (CFTe). Prior to TD Trader, he was the Chief Technical Analyst for Stockcharts.com and the main contributor to the ChartSchool.
PRINT THIS ARTICLE
TECHNICAL ANALYSIS
Nikkei Returns To Broken Trendline
06/24/04 04:46:26 PMby Arthur Hill
Here is the Nikkei with trendline break and triple resistance threat.
Position: N/A
| The Nikkei fired a warning shot at bulls with a trendline break, and the recovery rally is now running into a triple resistance threat. |
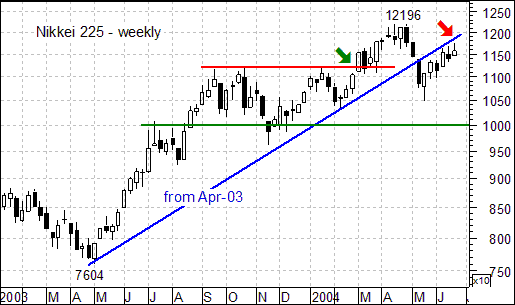
| As the weekly chart shows, the Nikkei staged an impressive advance from April 2003 to April 2004. Along the way, the index broke neckline resistance (green arrow) of an inverse head-and-shoulders pattern. Broken neckline resistance often turns into support, but failed to hold with the steep decline in late April/early May. This decline broke below the trendline extending up from April 2003. Moreover, this broken trendline extension is now providing resistance around 11870 (red arrow). |

|
| Figure 1: Weekly chart for the Nikkei |
| Graphic provided by: MetaStock. |
| |
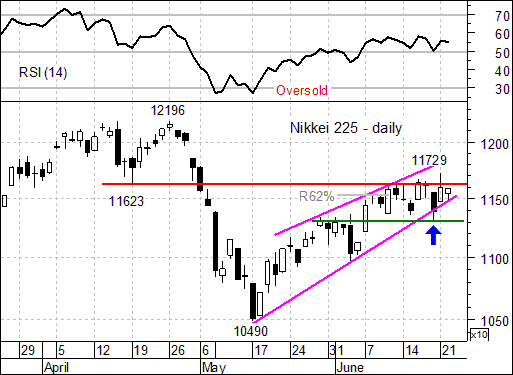
| The sharp decline from 12196 to 10499 was a shock to the system that created an oversold condition. Notice that the 14-day RSI moved below 30 (oversold) to confirm. The subsequent advance relieved that oversold condition and is now running into resistance confirmed by three items (hence the triple resistance threat). Including the April 2003 trendline extension, resistance also stems from a 62% retracement of the prior decline and broken support at 1162. |
 Figure 2: Daily chart for the Nikkei. In addition to the resistance threats, the pattern looks like a rising wedge (magenta trendlines), which is typical for a corrective advance. The Nikkei has already challenged the lower trendline, but found support around 11310 (blue arrow). As long as this level holds, the bulls have a fighting chance. However, a more below 11310 would signal a continuation lower and project weakness to around 10000. |
Arthur Hill is currently editor of TDTrader.com, a website specializing in trading strategies, sector/industry specific breadth stats and overall technical analysis. He passed the Society of Technical Analysts (STA London) diploma exam with distinction is a Certified Financial Technician (CFTe). Prior to TD Trader, he was the Chief Technical Analyst for Stockcharts.com and the main contributor to the ChartSchool.
| Title: | Editor |
| Company: | TDTrader.com |
| Address: | Willem Geetsstraat 17 |
| Mechelen, B2800 | |
| Phone # for sales: | 3215345465 |
| Website: | www.tdtrader.com |
| E-mail address: | arthurh@tdtrader.com |
Traders' Resource Links | |
| TDTrader.com has not added any product or service information to TRADERS' RESOURCE. | |
Click here for more information about our publications!
Comments
Date: 06/24/04Rank: 5Comment:

Request Information From Our Sponsors
- StockCharts.com, Inc.
- Candle Patterns
- Candlestick Charting Explained
- Intermarket Technical Analysis
- John Murphy on Chart Analysis
- John Murphy's Chart Pattern Recognition
- John Murphy's Market Message
- MurphyExplainsMarketAnalysis-Intermarket Analysis
- MurphyExplainsMarketAnalysis-Visual Analysis
- StockCharts.com
- Technical Analysis of the Financial Markets
- The Visual Investor
- VectorVest, Inc.
- Executive Premier Workshop
- One-Day Options Course
- OptionsPro
- Retirement Income Workshop
- Sure-Fire Trading Systems (VectorVest, Inc.)
- Trading as a Business Workshop
- VectorVest 7 EOD
- VectorVest 7 RealTime/IntraDay
- VectorVest AutoTester
- VectorVest Educational Services
- VectorVest OnLine
- VectorVest Options Analyzer
- VectorVest ProGraphics v6.0
- VectorVest ProTrader 7
- VectorVest RealTime Derby Tool
- VectorVest Simulator
- VectorVest Variator
- VectorVest Watchdog
