HOT TOPICS LIST
- MACD
- Fibonacci
- RSI
- Gann
- ADXR
- Stochastics
- Volume
- Triangles
- Futures
- Cycles
- Volatility
- ZIGZAG
- MESA
- Retracement
- Aroon
INDICATORS LIST
LIST OF TOPICS
PRINT THIS ARTICLE
by Arthur Hill
After a spectacle run, Qualcomm (QCOM) recently ran into resistance at 70 twice this year, with the indicator flashing a yellow light.
Position: Sell
Arthur Hill
Arthur Hill is currently editor of TDTrader.com, a website specializing in trading strategies, sector/industry specific breadth stats and overall technical analysis. He passed the Society of Technical Analysts (STA London) diploma exam with distinction is a Certified Financial Technician (CFTe). Prior to TD Trader, he was the Chief Technical Analyst for Stockcharts.com and the main contributor to the ChartSchool.
PRINT THIS ARTICLE
DOUBLE TOPS
Double Top For QualComm?
06/23/04 04:28:43 PMby Arthur Hill
After a spectacle run, Qualcomm (QCOM) recently ran into resistance at 70 twice this year, with the indicator flashing a yellow light.
Position: Sell
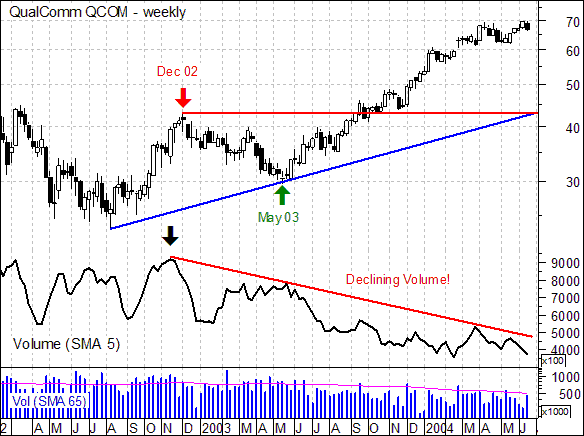
| On the weekly chart, it is clear that QCOM remains in an uptrend. However, the runup since May 2003 has been spectacular on price and light on volume. The last correction ended with the May 2003 low around 30 and the stock came within spitting distance of 70 in June. Despite this advance, the 5-week SMA for volume has shown a steady decline since November 2002 (black arrow). In fact, the 5-week SMA for volume is trading near its lowest levels in over two years. Unless volume steps up soon, there may not be enough fuel to propel the stock past resistance at 70. |

|
| Figure 1: Weekly chart for QCOM. |
| Graphic provided by: MetaStock. |
| |
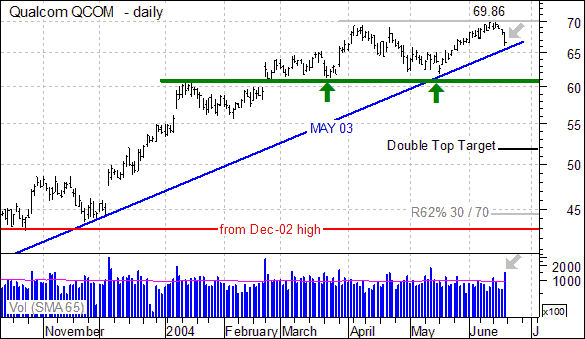
| Turning to the daily chart, a double top appears to be evolving with resistance at 70. The stock failed just below 70 in early April and again in mid-June. This most recent failure was followed by a high volume decline on June 18 (gray arrows). Expanding volume on the downside shows increased selling pressure and the trendline extending up from May 2003 is under assault. This trendline has been touched four times. |
 Daily chart for QCOM. |
| The double top is potential until confirmed with a support break and there is a support zone around 61 extending back to the January high. Broken resistance turned into support with a bounce in March and again in May (green arrows). A move below 61 would confirm the double top and project further weakness to around 52 (70 - 61 = 9, 61 - 9 = 52). Below 52, the next target is around 45, a level confirmed by a 62% retracement of the prior advance (30 to 70) and broken resistance (turned support) from the Dec 2002 high. |
Arthur Hill is currently editor of TDTrader.com, a website specializing in trading strategies, sector/industry specific breadth stats and overall technical analysis. He passed the Society of Technical Analysts (STA London) diploma exam with distinction is a Certified Financial Technician (CFTe). Prior to TD Trader, he was the Chief Technical Analyst for Stockcharts.com and the main contributor to the ChartSchool.
| Title: | Editor |
| Company: | TDTrader.com |
| Address: | Willem Geetsstraat 17 |
| Mechelen, B2800 | |
| Phone # for sales: | 3215345465 |
| Website: | www.tdtrader.com |
| E-mail address: | arthurh@tdtrader.com |
Traders' Resource Links | |
| TDTrader.com has not added any product or service information to TRADERS' RESOURCE. | |
Click here for more information about our publications!
Comments
Date: 06/23/04Rank: 5Comment:
Date: 06/26/04Rank: 5Comment:

Request Information From Our Sponsors
- VectorVest, Inc.
- Executive Premier Workshop
- One-Day Options Course
- OptionsPro
- Retirement Income Workshop
- Sure-Fire Trading Systems (VectorVest, Inc.)
- Trading as a Business Workshop
- VectorVest 7 EOD
- VectorVest 7 RealTime/IntraDay
- VectorVest AutoTester
- VectorVest Educational Services
- VectorVest OnLine
- VectorVest Options Analyzer
- VectorVest ProGraphics v6.0
- VectorVest ProTrader 7
- VectorVest RealTime Derby Tool
- VectorVest Simulator
- VectorVest Variator
- VectorVest Watchdog
- StockCharts.com, Inc.
- Candle Patterns
- Candlestick Charting Explained
- Intermarket Technical Analysis
- John Murphy on Chart Analysis
- John Murphy's Chart Pattern Recognition
- John Murphy's Market Message
- MurphyExplainsMarketAnalysis-Intermarket Analysis
- MurphyExplainsMarketAnalysis-Visual Analysis
- StockCharts.com
- Technical Analysis of the Financial Markets
- The Visual Investor
