HOT TOPICS LIST
- MACD
- Fibonacci
- RSI
- Gann
- ADXR
- Stochastics
- Volume
- Triangles
- Futures
- Cycles
- Volatility
- ZIGZAG
- MESA
- Retracement
- Aroon
INDICATORS LIST
LIST OF TOPICS
PRINT THIS ARTICLE
by Jason K. Hutson
A crossover of two moving averages presents a possible trading opportunity.
Position: N/A
Jason K. Hutson
Traders.com Staff Writer. Enjoys trendlines, support and resistance, moving averages, RSI, MACD, ADX, Bollinger bands, parabolic SAR, chart formations, and volume analysis.
PRINT THIS ARTICLE
MOVING AVERAGES
Using Moving Average Crossovers To Decrease Trading Risks
05/16/00 04:36:39 PMby Jason K. Hutson
A crossover of two moving averages presents a possible trading opportunity.
Position: N/A
| Moving averages are the averaged prices of a security for a specific period of time. For example, the last 12 closing prices for Symantec Corporation added together and divided by 12 would give today's 12-period moving average, and the last 24 closing prices divided by 24 would give today's 24-period moving average. Each day a new data point is plotted on the chart. |
| When the shorter, or faster, moving average crosses above the longer, or slower, moving average, the signal is considered a buy. |

|
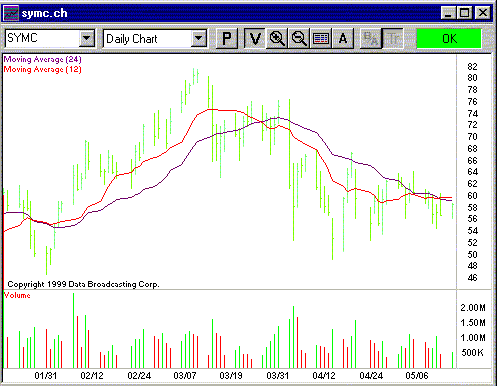
| Moving average crossover indicates price consolidation. The shorter period moving average (12-day) price is higher than the longer period moving average (24-day) indicating that after the consolidation, prices are moving higher. |
| Graphic provided by: eSignal. |
| |
| On the chart of SYMC notice that the price action for the 24-period moving average has slowly been catching up to the 12-period moving average. On May 12, 2000, the moving average price for the 12-period moving average exceeded the moving average price for the 24-period moving average, giving a buy signal at $59. Considering also that SYMC is in a trading range, see the article How to Profit From Trading Ranges, and the graph How to Profit From Trading Ranges, a trader must keep a close eye on the support and resistance levels of $50 and $70 respectively. |
| Trying to buy SYMC at any price under $60 at this point may be a good bargain because both moving averages have leveled off at that price level. By placing a stop order below $50 and making sure those moving averages do not both dip below $59 (moving average price support) an investor can enter a long trade with less risk. |
Traders.com Staff Writer. Enjoys trendlines, support and resistance, moving averages, RSI, MACD, ADX, Bollinger bands, parabolic SAR, chart formations, and volume analysis.
| Title: | Industrial Engineer |
| Company: | Technical Analysis, Inc. |
| Address: | 4757 California Ave SW |
| Seattle, WA 98116 | |
| Phone # for sales: | 206 938 0570 |
| Website: | Traders.com |
| E-mail address: | JasonHutson@Traders.com |
Traders' Resource Links | |
| Charting the Stock Market: The Wyckoff Method -- Books | |
| Working-Money.com -- Online Trading Services | |
| Traders.com Advantage -- Online Trading Services | |
| Technical Analysis of Stocks & Commodities -- Publications and Newsletters | |
| Working Money, at Working-Money.com -- Publications and Newsletters | |
| Traders.com Advantage -- Publications and Newsletters | |
| Professional Traders Starter Kit -- Software | |
Click here for more information about our publications!
Comments

|

Request Information From Our Sponsors
- StockCharts.com, Inc.
- Candle Patterns
- Candlestick Charting Explained
- Intermarket Technical Analysis
- John Murphy on Chart Analysis
- John Murphy's Chart Pattern Recognition
- John Murphy's Market Message
- MurphyExplainsMarketAnalysis-Intermarket Analysis
- MurphyExplainsMarketAnalysis-Visual Analysis
- StockCharts.com
- Technical Analysis of the Financial Markets
- The Visual Investor
- VectorVest, Inc.
- Executive Premier Workshop
- One-Day Options Course
- OptionsPro
- Retirement Income Workshop
- Sure-Fire Trading Systems (VectorVest, Inc.)
- Trading as a Business Workshop
- VectorVest 7 EOD
- VectorVest 7 RealTime/IntraDay
- VectorVest AutoTester
- VectorVest Educational Services
- VectorVest OnLine
- VectorVest Options Analyzer
- VectorVest ProGraphics v6.0
- VectorVest ProTrader 7
- VectorVest RealTime Derby Tool
- VectorVest Simulator
- VectorVest Variator
- VectorVest Watchdog
