HOT TOPICS LIST
- MACD
- Fibonacci
- RSI
- Gann
- ADXR
- Stochastics
- Volume
- Triangles
- Futures
- Cycles
- Volatility
- ZIGZAG
- MESA
- Retracement
- Aroon
INDICATORS LIST
LIST OF TOPICS
PRINT THIS ARTICLE
by Jason K. Hutson
The stock market has experienced a short-term downswing for more than one month. This downswing has cost investors a quick 35% on their investments. During the shakeout of this high volitility period an investor can take a small amount of risk by trading between support and resistance levels using stop loss orders.
Position: N/A
Jason K. Hutson
Traders.com Staff Writer. Enjoys trendlines, support and resistance, moving averages, RSI, MACD, ADX, Bollinger bands, parabolic SAR, chart formations, and volume analysis.
PRINT THIS ARTICLE
How To Profit From Trading Ranges
05/09/00 02:56:22 PMby Jason K. Hutson
The stock market has experienced a short-term downswing for more than one month. This downswing has cost investors a quick 35% on their investments. During the shakeout of this high volitility period an investor can take a small amount of risk by trading between support and resistance levels using stop loss orders.
Position: N/A
| The downtrend for the Nasdaq stock market appeared to pick a short-term level of support at around 3300 points in the middle of April, 2000. The dramatic selling spree quickly retraced itself by about 14% in two weeks. Economic conditions continued to show signs of weakness as the markets appeared to meet resistance. The market had now established support and resistance levels. |
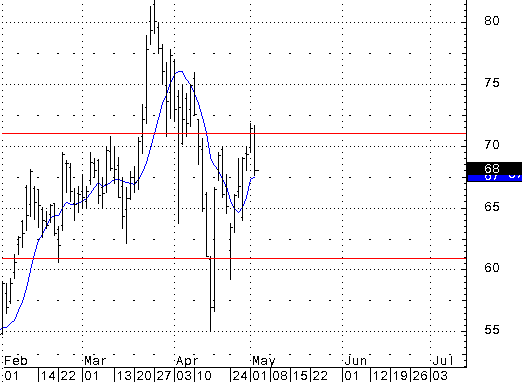
| Before applying trading ranges to specific securities, the trader should have identified an overperforming sector, and from that sector, selected a few outstanding individual companies. Now trading ranges can be used to establish their entry and exit points. For this first example CSCO is shown struggling to exit a resistance level that was set at the end of February, 2000. Technically, CSCO has a positive trend going back to its inital public offering. So a trader would still like to be a part of those strong upswings. |

|
| CSCO as of 5/2/2000 |
| Graphic provided by: CQGNET. |
| |
| Exit and entry points should be established before entering a trade. There seems to be a good possibility that CSCO may trade in between the ranges of $62-$72 over the next couple of months. Currently the price is $68. Now the investor has four options for entering a trade: 1. BUY CSCO. Place a stop at 59 1/2, hope it pushes past $72 and continues upward. Possible sell at $76 or $82. 2. SELL SHORT CSCO. Place a stop at $72 and hope for prices to go lower. Possible buy $62 or $60. 3. BUY LIMIT CSCO. Place a buy limit order for CSCO at $62 and after the order is executed (if the price declines that low), place a stop loss order at $59 1/2. Possible sell at $72, $76, or $82 4. BUY STOP at $72. |
| The best option depends on the investor. Time frame, capital, patience, assertiveness, rule following, and temperament are all large parts of trading success. |
| Positives: Option 1- CSCO has had strong returns year after year, and earnings come out May 9th. This approach is very long-term. Option 2- Possibly a very short trade, only lasting a few days. Possible 10% change in value. Relatively little risk. Option 3- Safe and conservative, and if you miss out on a real upward rally you will buy in with Option 4. Option 4- Possible to catch a ride on a nice upward wave. Negatives: Option 1- May end up in a year-long trading range like DELL from February, 1999 to March, 2000. Option 2- Limited downside potential. Option 3- Might not ever see $62 again. Option 4- Exhaustive buying catches your stop and immediately retreats. These simple support and resistance lines give traders rules to follow that minimize risk while entering and exiting their trades. Further examples are given following this article, showing current stock prices with support and resistance lines. These stocks can be bought and sold using the same four options shown in CSCO. |
Traders.com Staff Writer. Enjoys trendlines, support and resistance, moving averages, RSI, MACD, ADX, Bollinger bands, parabolic SAR, chart formations, and volume analysis.
| Title: | Industrial Engineer |
| Company: | Technical Analysis, Inc. |
| Address: | 4757 California Ave SW |
| Seattle, WA 98116 | |
| Phone # for sales: | 206 938 0570 |
| Website: | Traders.com |
| E-mail address: | JasonHutson@Traders.com |
Traders' Resource Links | |
| Charting the Stock Market: The Wyckoff Method -- Books | |
| Working-Money.com -- Online Trading Services | |
| Traders.com Advantage -- Online Trading Services | |
| Technical Analysis of Stocks & Commodities -- Publications and Newsletters | |
| Working Money, at Working-Money.com -- Publications and Newsletters | |
| Traders.com Advantage -- Publications and Newsletters | |
| Professional Traders Starter Kit -- Software | |
Click here for more information about our publications!
Comments

Request Information From Our Sponsors
- StockCharts.com, Inc.
- Candle Patterns
- Candlestick Charting Explained
- Intermarket Technical Analysis
- John Murphy on Chart Analysis
- John Murphy's Chart Pattern Recognition
- John Murphy's Market Message
- MurphyExplainsMarketAnalysis-Intermarket Analysis
- MurphyExplainsMarketAnalysis-Visual Analysis
- StockCharts.com
- Technical Analysis of the Financial Markets
- The Visual Investor
- VectorVest, Inc.
- Executive Premier Workshop
- One-Day Options Course
- OptionsPro
- Retirement Income Workshop
- Sure-Fire Trading Systems (VectorVest, Inc.)
- Trading as a Business Workshop
- VectorVest 7 EOD
- VectorVest 7 RealTime/IntraDay
- VectorVest AutoTester
- VectorVest Educational Services
- VectorVest OnLine
- VectorVest Options Analyzer
- VectorVest ProGraphics v6.0
- VectorVest ProTrader 7
- VectorVest RealTime Derby Tool
- VectorVest Simulator
- VectorVest Variator
- VectorVest Watchdog
