

HOT TOPICS LIST
- MACD
- Fibonacci
- RSI
- Gann
- ADXR
- Stochastics
- Volume
- Triangles
- Futures
- Cycles
- Volatility
- ZIGZAG
- MESA
- Retracement
- Aroon
INDICATORS LIST
LIST OF TOPICS
PRINT THIS ARTICLE
by Arthur Hill
Despite weakness in the finance sector over the last few months, AIG has held up relatively well. That may be about to change as a potential bearish reversal pattern evolves.
Position: N/A
Arthur Hill
Arthur Hill is currently editor of TDTrader.com, a website specializing in trading strategies, sector/industry specific breadth stats and overall technical analysis. He passed the Society of Technical Analysts (STA London) diploma exam with distinction is a Certified Financial Technician (CFTe). Prior to TD Trader, he was the Chief Technical Analyst for Stockcharts.com and the main contributor to the ChartSchool.
PRINT THIS ARTICLE
HEAD & SHOULDERS
AIG Forms Potential Head And Shoulders
06/14/04 08:59:20 AMby Arthur Hill
Despite weakness in the finance sector over the last few months, AIG has held up relatively well. That may be about to change as a potential bearish reversal pattern evolves.
Position: N/A
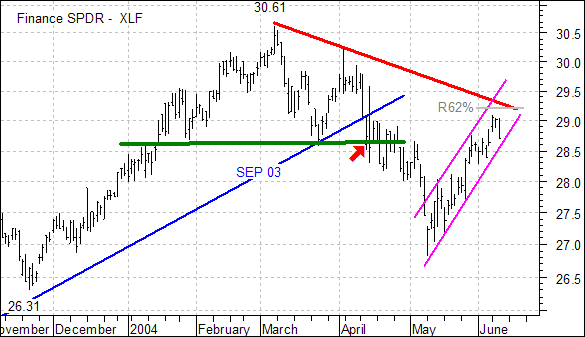
| The Finance Sector, as represented by the Financial SPDR (XLF), declined sharply from early March to early May. XLF broke below the Sep-03 trendline and its March low with a 10% decline (red arrow). The recovery over the last few weeks has been sharp, but it looks like a rising flag is closing in on a reversal zone. Why a reversal zone? Because the advance has retraced 62% of the prior decline and is nearing the trendline extending down from March. |
|
| Figure 1: Daily chart of SPDR - XLF. |
| Graphic provided by: MetaStock. |
| |
| Even though AIG held above its March low and held up relatively well over the last few months, the current pattern could evolve into a head and shoulders reversal. The left shoulder formed in February/March, the head in April, and the right shoulder in June. Notice that volume on the right shoulder advance was relatively low (blue arrow). The advance was low on fuel and this increases the odds of a failure at or below the prior highs. |
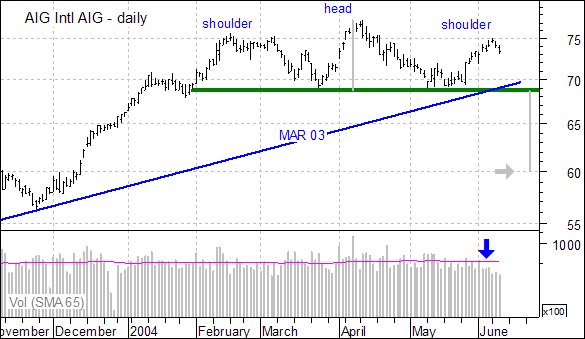 Figure 2: Chart of AIG. Keep in mind that this head and shoulders pattern is a "potential" bearish reversal until confirmed. Neckline support is set at 68.70 and is confirmed by the trendline extending up from March 2003. A move below 68.7 would confirm the head and shoulders and project further weakness to around 60 (gray arrow). |
Arthur Hill is currently editor of TDTrader.com, a website specializing in trading strategies, sector/industry specific breadth stats and overall technical analysis. He passed the Society of Technical Analysts (STA London) diploma exam with distinction is a Certified Financial Technician (CFTe). Prior to TD Trader, he was the Chief Technical Analyst for Stockcharts.com and the main contributor to the ChartSchool.
| Title: | Editor |
| Company: | TDTrader.com |
| Address: | Willem Geetsstraat 17 |
| Mechelen, B2800 | |
| Phone # for sales: | 3215345465 |
| Website: | www.tdtrader.com |
| E-mail address: | arthurh@tdtrader.com |
Traders' Resource Links | |
| TDTrader.com has not added any product or service information to TRADERS' RESOURCE. | |
Click here for more information about our publications!
PRINT THIS ARTICLE

Request Information From Our Sponsors
- StockCharts.com, Inc.
- Candle Patterns
- Candlestick Charting Explained
- Intermarket Technical Analysis
- John Murphy on Chart Analysis
- John Murphy's Chart Pattern Recognition
- John Murphy's Market Message
- MurphyExplainsMarketAnalysis-Intermarket Analysis
- MurphyExplainsMarketAnalysis-Visual Analysis
- StockCharts.com
- Technical Analysis of the Financial Markets
- The Visual Investor
- VectorVest, Inc.
- Executive Premier Workshop
- One-Day Options Course
- OptionsPro
- Retirement Income Workshop
- Sure-Fire Trading Systems (VectorVest, Inc.)
- Trading as a Business Workshop
- VectorVest 7 EOD
- VectorVest 7 RealTime/IntraDay
- VectorVest AutoTester
- VectorVest Educational Services
- VectorVest OnLine
- VectorVest Options Analyzer
- VectorVest ProGraphics v6.0
- VectorVest ProTrader 7
- VectorVest RealTime Derby Tool
- VectorVest Simulator
- VectorVest Variator
- VectorVest Watchdog