HOT TOPICS LIST
- MACD
- Fibonacci
- RSI
- Gann
- ADXR
- Stochastics
- Volume
- Triangles
- Futures
- Cycles
- Volatility
- ZIGZAG
- MESA
- Retracement
- Aroon
INDICATORS LIST
LIST OF TOPICS
PRINT THIS ARTICLE
by Arthur Hill
Since the big uptrend began in March 2003, OEX has formed its second consolidation and this one looks a lot like the first.
Position: Hold
Arthur Hill
Arthur Hill is currently editor of TDTrader.com, a website specializing in trading strategies, sector/industry specific breadth stats and overall technical analysis. He passed the Society of Technical Analysts (STA London) diploma exam with distinction is a Certified Financial Technician (CFTe). Prior to TD Trader, he was the Chief Technical Analyst for Stockcharts.com and the main contributor to the ChartSchool.
PRINT THIS ARTICLE
FLAGS AND PENNANTS
Deja vu All Over Again For OEX
05/28/04 01:26:25 PMby Arthur Hill
Since the big uptrend began in March 2003, OEX has formed its second consolidation and this one looks a lot like the first.
Position: Hold
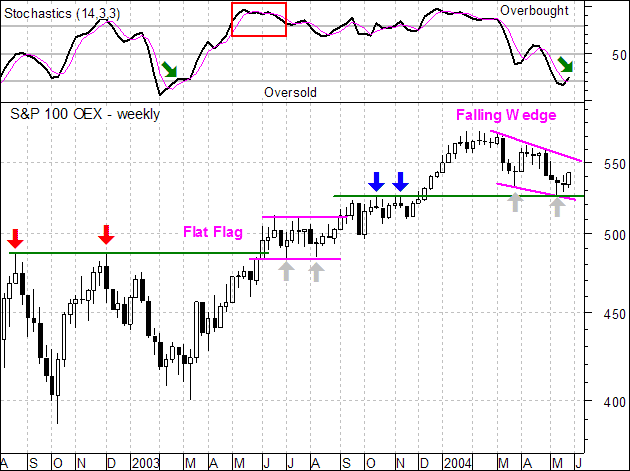
| The first consolidation formed in June, July and August of 2003 as a flat flag. After a sharp advance from the March low, a period of rest was needed. This can come in the form of a consolidation or a correction. OEX traded flat for three months to form the flat flag and alleviate the overbought condition. Notice that the stochastic oscillator moved above 80 in early May and remained overbought (above 80) until early August (red box). |

|
| Weekly chart of the OEX. |
| Graphic provided by: MetaStock. |
| |
| The current consolidation is more corrective in nature as the index formed a falling wedge. The decline retraced around 50% of the Aug-03 to Jan-04 advance and the pattern is typical for a correction. Correction is the key word as the pattern is not typical for an impulse move lower. This suggests that the decline will be relatively short and the uptrend will resume. Notice that the stochastic oscillator moved to oversold for the first time since March 2003 (green arrows). |
| Even though the consolidation patterns are not identical, characteristics in the flat flag could help predict a reversal in the falling wedge. First, the flat flag extended from June to August and lasted three months. The falling wedge extended from March to May and is nearing the end of its third month. Second, the flat flag found support near broken resistance from the Aug-02 and Dec-02 highs (red arrows). The falling wedge is starting to firm near the Oct-03 and Nov-03 highs (blue arrows) as broken resistance turns into support. And finally, the flat flag formed two reaction lows (gray arrows) before resuming the uptrend. The falling wedge formed a reaction low in March and could be in the process of forming its second reaction low in May with two doji candlesticks. |
| The falling wedge consolidation is potentially bullish and it would take at least a move above the upper line for confirmation. Such a breakout would signal a continuation of the August to January advance and project new highs in the index. |
Arthur Hill is currently editor of TDTrader.com, a website specializing in trading strategies, sector/industry specific breadth stats and overall technical analysis. He passed the Society of Technical Analysts (STA London) diploma exam with distinction is a Certified Financial Technician (CFTe). Prior to TD Trader, he was the Chief Technical Analyst for Stockcharts.com and the main contributor to the ChartSchool.
| Title: | Editor |
| Company: | TDTrader.com |
| Address: | Willem Geetsstraat 17 |
| Mechelen, B2800 | |
| Phone # for sales: | 3215345465 |
| Website: | www.tdtrader.com |
| E-mail address: | arthurh@tdtrader.com |
Traders' Resource Links | |
| TDTrader.com has not added any product or service information to TRADERS' RESOURCE. | |
Click here for more information about our publications!
Comments
Date: 05/30/04Rank: 5Comment:
Date: 05/30/04Rank: 4Comment:
Date: 06/01/04Rank: 5Comment:
Date: 06/02/04Rank: 5Comment:

Request Information From Our Sponsors
- StockCharts.com, Inc.
- Candle Patterns
- Candlestick Charting Explained
- Intermarket Technical Analysis
- John Murphy on Chart Analysis
- John Murphy's Chart Pattern Recognition
- John Murphy's Market Message
- MurphyExplainsMarketAnalysis-Intermarket Analysis
- MurphyExplainsMarketAnalysis-Visual Analysis
- StockCharts.com
- Technical Analysis of the Financial Markets
- The Visual Investor
- VectorVest, Inc.
- Executive Premier Workshop
- One-Day Options Course
- OptionsPro
- Retirement Income Workshop
- Sure-Fire Trading Systems (VectorVest, Inc.)
- Trading as a Business Workshop
- VectorVest 7 EOD
- VectorVest 7 RealTime/IntraDay
- VectorVest AutoTester
- VectorVest Educational Services
- VectorVest OnLine
- VectorVest Options Analyzer
- VectorVest ProGraphics v6.0
- VectorVest ProTrader 7
- VectorVest RealTime Derby Tool
- VectorVest Simulator
- VectorVest Variator
- VectorVest Watchdog
