HOT TOPICS LIST
- MACD
- Fibonacci
- RSI
- Gann
- ADXR
- Stochastics
- Volume
- Triangles
- Futures
- Cycles
- Volatility
- ZIGZAG
- MESA
- Retracement
- Aroon
INDICATORS LIST
LIST OF TOPICS
PRINT THIS ARTICLE
by Luis Ferro
Hewlett Packard (HPQ) completed a head and shoulders pattern that forecasts lower prices for this hardware manufacturer. Prices had not fallen much before hitting an old support level. But other factors suggest this is only a temporary stop in a longer-term downtrend for HPQ.
Position: Sell
Luis Ferro
Trader and technical analyst living in Bern, Switzerland. A full member of the STA, currently enrolled in the DITA program and the CMT program.
PRINT THIS ARTICLE
HEAD & SHOULDERS
Head And Shoulders In Hewlett Packard Forecasts Lower Prices
05/24/04 01:59:25 PMby Luis Ferro
Hewlett Packard (HPQ) completed a head and shoulders pattern that forecasts lower prices for this hardware manufacturer. Prices had not fallen much before hitting an old support level. But other factors suggest this is only a temporary stop in a longer-term downtrend for HPQ.
Position: Sell
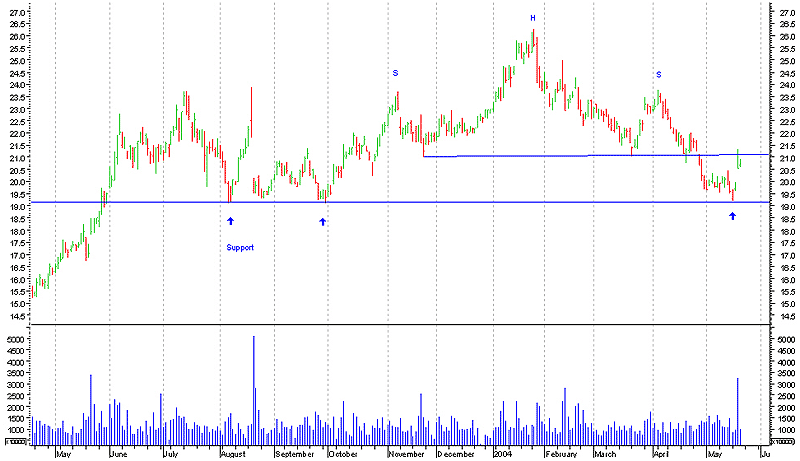
| At the end of April HPQ broke below the neckline level of a head and shoulders pattern. This formation has strong bearish implications for the stock, especially since it took almost six months to complete this pattern and chart patterns derive strength from their magnitude (height) as well as their duration. |

|
| Graphic provided by: MetaStock. |
| |
| It is possible to establish a price objective for HPQ from the head and shoulders pattern. This is done by measuring the height of the formation, from the neckline until the highest point in the head and subtracting this value from the breakout point. In this case the price target is the following: Formation height: 26.5 - 21 = 5.5 Price Target: 21 - 5.5 = 15.5 |
| Technical analysis theory states that the price target is the minimum distance prices should retrace. In practice it is necessary to adjust this technique to different real-life situations. For example, it is more likely for a bullish pattern to reach a minimum price objective than it is for a bearish one, because while there is no limit to how much a stock can increase, the maximum loss can only be 100%. It is also very important to adjust price objectives taking into account important support and resistance levels. The price target for Hewlett Packard derrived from the head and shoulders is 15.5, but an important support level at 19 stopped the downward movement of the stock, at least temporarily. |
| There was also a previous unfilled gap at the neckline level of the head and shoulders. Unfilled gaps tend to act like magnets, attracting prices to their level until the gap is filled, and indeed price returned to the gap level. In this move another gap formed. This last gap occurred on very high volume, suggesting it might be a breakaway gap. But the following day, volume was very low, as buyers didn't seen interested at these new prices. While it is not clear what will happen in the short-term, the medium and long-term trends are still bearish. This last gap will probably draw the price of HPQ lower, although not necessarily in the short-term, and since the head and shoulders bearish implications are still valid it is likely that prices will continue to fall after that. |
Trader and technical analyst living in Bern, Switzerland. A full member of the STA, currently enrolled in the DITA program and the CMT program.
| Address: | Switzerland |
| E-mail address: | luispgsf@yahoo.com |
Click here for more information about our publications!
Comments
Date: 05/24/04Rank: 5Comment:
Date: 05/25/04Rank: 5Comment:
Date: 05/26/04Rank: 3Comment:

|

Request Information From Our Sponsors
- StockCharts.com, Inc.
- Candle Patterns
- Candlestick Charting Explained
- Intermarket Technical Analysis
- John Murphy on Chart Analysis
- John Murphy's Chart Pattern Recognition
- John Murphy's Market Message
- MurphyExplainsMarketAnalysis-Intermarket Analysis
- MurphyExplainsMarketAnalysis-Visual Analysis
- StockCharts.com
- Technical Analysis of the Financial Markets
- The Visual Investor
- VectorVest, Inc.
- Executive Premier Workshop
- One-Day Options Course
- OptionsPro
- Retirement Income Workshop
- Sure-Fire Trading Systems (VectorVest, Inc.)
- Trading as a Business Workshop
- VectorVest 7 EOD
- VectorVest 7 RealTime/IntraDay
- VectorVest AutoTester
- VectorVest Educational Services
- VectorVest OnLine
- VectorVest Options Analyzer
- VectorVest ProGraphics v6.0
- VectorVest ProTrader 7
- VectorVest RealTime Derby Tool
- VectorVest Simulator
- VectorVest Variator
- VectorVest Watchdog
