HOT TOPICS LIST
- MACD
- Fibonacci
- RSI
- Gann
- ADXR
- Stochastics
- Volume
- Triangles
- Futures
- Cycles
- Volatility
- ZIGZAG
- MESA
- Retracement
- Aroon
INDICATORS LIST
LIST OF TOPICS
PRINT THIS ARTICLE
by Arthur Hill
The S&P 400 Midcap iShare (MDY) recently confirmed a double top and has now formed a volatile consolidation just below broken support.
Position: Sell
Arthur Hill
Arthur Hill is currently editor of TDTrader.com, a website specializing in trading strategies, sector/industry specific breadth stats and overall technical analysis. He passed the Society of Technical Analysts (STA London) diploma exam with distinction is a Certified Financial Technician (CFTe). Prior to TD Trader, he was the Chief Technical Analyst for Stockcharts.com and the main contributor to the ChartSchool.
PRINT THIS ARTICLE
DOUBLE TOPS
Midcap iShare MDY Consolidates After Support Break
05/24/04 09:24:37 AMby Arthur Hill
The S&P 400 Midcap iShare (MDY) recently confirmed a double top and has now formed a volatile consolidation just below broken support.
Position: Sell
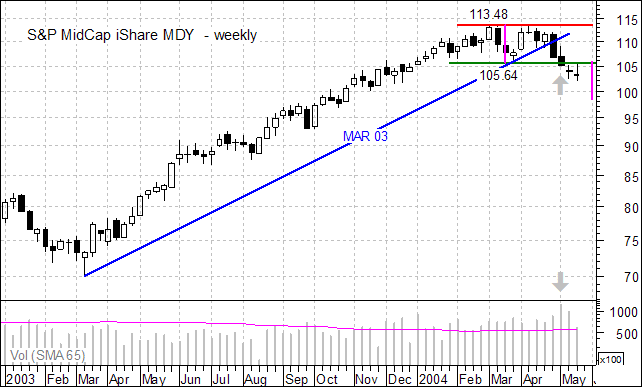
| Looking at the weekly chart for some perspective, the stock went on a major bull run from Mar-03 to Mar-04. It stalled just below 115 as two peaks formed in March and April. Combined with the intermittent low in March, a double top evolved with key support at 105.64. |

|
| Figure 1: Weekly chart of MDY. |
| Graphic provided by: MetaStock. |
| |
| The decline in April and May broke below the trendline extending up from Mar-03 and below the Mar-04 low to confirm the double top. Based on traditional technical analysis, the projected decline would be to around 98 (113.48 - 105.64 = 7.84, 105.64 - 7.84 = 97.8). Also notice that volume expanded on the support break as selling pressure intensified (gray arrows). |
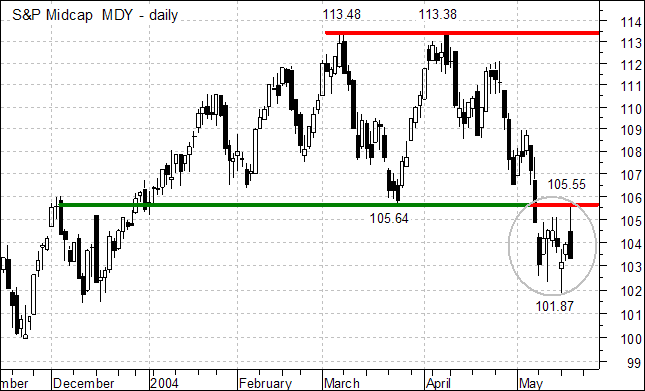
 Figure 2: Daily chart of MDY. Broken support at 105.64 has now turned into resistance as the stock consolidates (gray oval). This is the first level to watch for signs of strength and a break above this level would open the door to a retracement of the prior decline (103.38 to 101.87). |
| Even though the consolidation is not a picture perfect pennant or flag, it should be considered a bearish continuation pattern. The index declined sharply from around 113 to around 102 and then paused for a rest. The prior move was down and a continuation should be expected. A move below the consolidation low at 101.87 would signal a continuation down and the next target would be the double bottom projection around 98. |
Arthur Hill is currently editor of TDTrader.com, a website specializing in trading strategies, sector/industry specific breadth stats and overall technical analysis. He passed the Society of Technical Analysts (STA London) diploma exam with distinction is a Certified Financial Technician (CFTe). Prior to TD Trader, he was the Chief Technical Analyst for Stockcharts.com and the main contributor to the ChartSchool.
| Title: | Editor |
| Company: | TDTrader.com |
| Address: | Willem Geetsstraat 17 |
| Mechelen, B2800 | |
| Phone # for sales: | 3215345465 |
| Website: | www.tdtrader.com |
| E-mail address: | arthurh@tdtrader.com |
Traders' Resource Links | |
| TDTrader.com has not added any product or service information to TRADERS' RESOURCE. | |
Click here for more information about our publications!
PRINT THIS ARTICLE

Request Information From Our Sponsors
- StockCharts.com, Inc.
- Candle Patterns
- Candlestick Charting Explained
- Intermarket Technical Analysis
- John Murphy on Chart Analysis
- John Murphy's Chart Pattern Recognition
- John Murphy's Market Message
- MurphyExplainsMarketAnalysis-Intermarket Analysis
- MurphyExplainsMarketAnalysis-Visual Analysis
- StockCharts.com
- Technical Analysis of the Financial Markets
- The Visual Investor
- VectorVest, Inc.
- Executive Premier Workshop
- One-Day Options Course
- OptionsPro
- Retirement Income Workshop
- Sure-Fire Trading Systems (VectorVest, Inc.)
- Trading as a Business Workshop
- VectorVest 7 EOD
- VectorVest 7 RealTime/IntraDay
- VectorVest AutoTester
- VectorVest Educational Services
- VectorVest OnLine
- VectorVest Options Analyzer
- VectorVest ProGraphics v6.0
- VectorVest ProTrader 7
- VectorVest RealTime Derby Tool
- VectorVest Simulator
- VectorVest Variator
- VectorVest Watchdog
