HOT TOPICS LIST
- MACD
- Fibonacci
- RSI
- Gann
- ADXR
- Stochastics
- Volume
- Triangles
- Futures
- Cycles
- Volatility
- ZIGZAG
- MESA
- Retracement
- Aroon
INDICATORS LIST
LIST OF TOPICS
PRINT THIS ARTICLE
by Arthur Hill
The Dow Jones Wireless Communications Index (DJUSWC) remains in both a long-term and medium-term uptrend with important trendlines still holding.
Position: Hold
Arthur Hill
Arthur Hill is currently editor of TDTrader.com, a website specializing in trading strategies, sector/industry specific breadth stats and overall technical analysis. He passed the Society of Technical Analysts (STA London) diploma exam with distinction is a Certified Financial Technician (CFTe). Prior to TD Trader, he was the Chief Technical Analyst for Stockcharts.com and the main contributor to the ChartSchool.
PRINT THIS ARTICLE
WEDGE FORMATIONS
Wireless Index Still Holding Important Trendlines
05/13/04 11:00:53 AMby Arthur Hill
The Dow Jones Wireless Communications Index (DJUSWC) remains in both a long-term and medium-term uptrend with important trendlines still holding.
Position: Hold
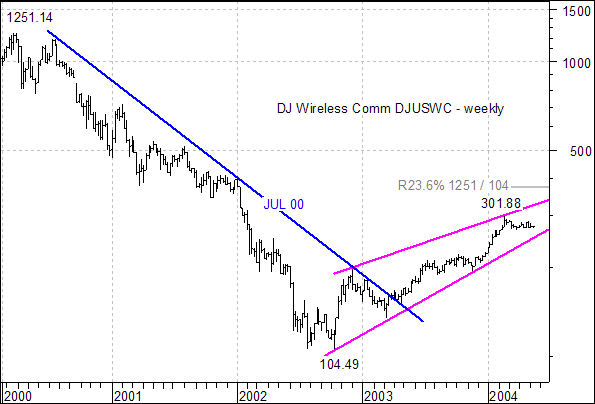
 Figure 1: Weekly chart of DJUSWC. The weekly chart shows a pattern familiar to many telecom, dotcom and technology stocks. After peaking in early 2000, a severe decline ensued and lasted until October 2002. The advance from October 2002 to the present formed a rising wedge that retraced a portion of the prior decline. |
| The Mar-00 to Oct-02 decline was especially severe for DJUSWC and the current advance from 104.49 to 301.44 has retraced less than 20% of the prior advance. The rising wedge is a potentially bearish pattern, but the trend is clearly bullish as long as the lower trendline holds. A move below the lower trendline (currently at 255) would signal a continuation of the prior decline and project further weakness below the October 2002 low. |

|
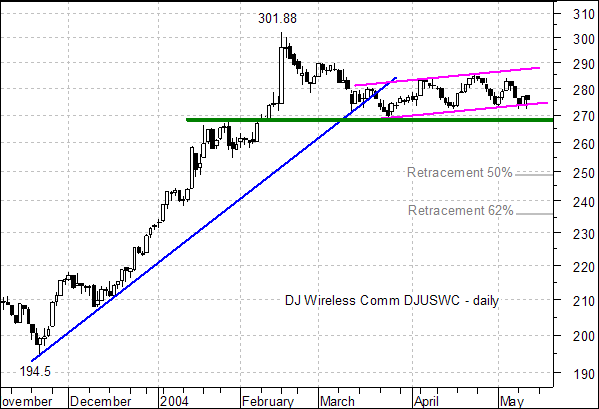
| Figure 2: Daily chart of DJUSWC. |
| Graphic provided by: MetaStock. |
| |
| Turning to the daily chart, the DJ Wireless Communications Index also remains in an uptrend with a rising flag or price channel forming over the last two months. These are also potentially bearish patterns that require confirmation with a trendline break. In addition, there is broken resistance (turned support) around 268. As long as this support line holds, the bulls get the benefit of the doubt. A move below 268 would be bearish and at a 50-62% retracement of the prior advance (194.5 to 301.88) would then be expected. |
Arthur Hill is currently editor of TDTrader.com, a website specializing in trading strategies, sector/industry specific breadth stats and overall technical analysis. He passed the Society of Technical Analysts (STA London) diploma exam with distinction is a Certified Financial Technician (CFTe). Prior to TD Trader, he was the Chief Technical Analyst for Stockcharts.com and the main contributor to the ChartSchool.
| Title: | Editor |
| Company: | TDTrader.com |
| Address: | Willem Geetsstraat 17 |
| Mechelen, B2800 | |
| Phone # for sales: | 3215345465 |
| Website: | www.tdtrader.com |
| E-mail address: | arthurh@tdtrader.com |
Traders' Resource Links | |
| TDTrader.com has not added any product or service information to TRADERS' RESOURCE. | |
Click here for more information about our publications!
PRINT THIS ARTICLE

Request Information From Our Sponsors
- StockCharts.com, Inc.
- Candle Patterns
- Candlestick Charting Explained
- Intermarket Technical Analysis
- John Murphy on Chart Analysis
- John Murphy's Chart Pattern Recognition
- John Murphy's Market Message
- MurphyExplainsMarketAnalysis-Intermarket Analysis
- MurphyExplainsMarketAnalysis-Visual Analysis
- StockCharts.com
- Technical Analysis of the Financial Markets
- The Visual Investor
- VectorVest, Inc.
- Executive Premier Workshop
- One-Day Options Course
- OptionsPro
- Retirement Income Workshop
- Sure-Fire Trading Systems (VectorVest, Inc.)
- Trading as a Business Workshop
- VectorVest 7 EOD
- VectorVest 7 RealTime/IntraDay
- VectorVest AutoTester
- VectorVest Educational Services
- VectorVest OnLine
- VectorVest Options Analyzer
- VectorVest ProGraphics v6.0
- VectorVest ProTrader 7
- VectorVest RealTime Derby Tool
- VectorVest Simulator
- VectorVest Variator
- VectorVest Watchdog
