HOT TOPICS LIST
- MACD
- Fibonacci
- RSI
- Gann
- ADXR
- Stochastics
- Volume
- Triangles
- Futures
- Cycles
- Volatility
- ZIGZAG
- MESA
- Retracement
- Aroon
INDICATORS LIST
LIST OF TOPICS
PRINT THIS ARTICLE
by Arthur Hill
With the prospects of higher interest rates down the road, it is little surprise that the Dow Utilities are forming a potentially bearish pattern with waning upside momentum.
Position: N/A
Arthur Hill
Arthur Hill is currently editor of TDTrader.com, a website specializing in trading strategies, sector/industry specific breadth stats and overall technical analysis. He passed the Society of Technical Analysts (STA London) diploma exam with distinction is a Certified Financial Technician (CFTe). Prior to TD Trader, he was the Chief Technical Analyst for Stockcharts.com and the main contributor to the ChartSchool.
PRINT THIS ARTICLE
WEDGE FORMATIONS
Dow Utilities Form Massive Wedge
05/04/04 01:32:58 PMby Arthur Hill
With the prospects of higher interest rates down the road, it is little surprise that the Dow Utilities are forming a potentially bearish pattern with waning upside momentum.
Position: N/A
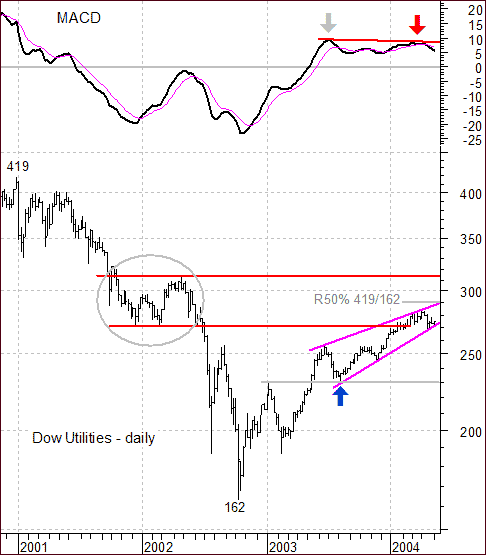
| After a major decline in 2001 and 2002, the Dow Jones Utility Average expelled Enron and began to recoup its losses. The advance over the last 18 months evolved into a rising wedge (magenta trendlines) and the average is entering a formidable resistance zone confirmed by two items. First, there is a large consolidation between 270 and 310 (gray oval). Broken support at the lower end turns into resistance and the prior highs at the upper end make for a natural barrier. Second, the advance from 162 to 283 retraced a little less than 50% of the prior decline. This is quite normal for a corrective advance. |

|
| Graphic provided by: MetaStock. |
| |
| In addition to resistance and the rising wedge, upside momentum is waning. Upside momentum was strong in late 2002 and early 2003 as MACD moved from deep negative territory to its July peak (gray arrow). Even though the advance continued, MACD turned flat and formed a lower high in 2003 (red arrow) for a bearish divergence. Momentum was still up, but not as strong as before. The subsequent signal line crossover is further bearish evidence and the final straw would be a cross into negative territory for MACD. |
| As long as the wedge rises, it is wise to respect the bulls. The trendline extending up from the August lows (blue arrow) defines the wedge and the uptrend. A move below this trendline would be negative and argue for at least a retracement of the prior advance or possibly even a continuation of the 2001/2002 decline. |
Arthur Hill is currently editor of TDTrader.com, a website specializing in trading strategies, sector/industry specific breadth stats and overall technical analysis. He passed the Society of Technical Analysts (STA London) diploma exam with distinction is a Certified Financial Technician (CFTe). Prior to TD Trader, he was the Chief Technical Analyst for Stockcharts.com and the main contributor to the ChartSchool.
| Title: | Editor |
| Company: | TDTrader.com |
| Address: | Willem Geetsstraat 17 |
| Mechelen, B2800 | |
| Phone # for sales: | 3215345465 |
| Website: | www.tdtrader.com |
| E-mail address: | arthurh@tdtrader.com |
Traders' Resource Links | |
| TDTrader.com has not added any product or service information to TRADERS' RESOURCE. | |
Click here for more information about our publications!
PRINT THIS ARTICLE

Request Information From Our Sponsors
- VectorVest, Inc.
- Executive Premier Workshop
- One-Day Options Course
- OptionsPro
- Retirement Income Workshop
- Sure-Fire Trading Systems (VectorVest, Inc.)
- Trading as a Business Workshop
- VectorVest 7 EOD
- VectorVest 7 RealTime/IntraDay
- VectorVest AutoTester
- VectorVest Educational Services
- VectorVest OnLine
- VectorVest Options Analyzer
- VectorVest ProGraphics v6.0
- VectorVest ProTrader 7
- VectorVest RealTime Derby Tool
- VectorVest Simulator
- VectorVest Variator
- VectorVest Watchdog
- StockCharts.com, Inc.
- Candle Patterns
- Candlestick Charting Explained
- Intermarket Technical Analysis
- John Murphy on Chart Analysis
- John Murphy's Chart Pattern Recognition
- John Murphy's Market Message
- MurphyExplainsMarketAnalysis-Intermarket Analysis
- MurphyExplainsMarketAnalysis-Visual Analysis
- StockCharts.com
- Technical Analysis of the Financial Markets
- The Visual Investor
