HOT TOPICS LIST
- MACD
- Fibonacci
- RSI
- Gann
- ADXR
- Stochastics
- Volume
- Triangles
- Futures
- Cycles
- Volatility
- ZIGZAG
- MESA
- Retracement
- Aroon
INDICATORS LIST
LIST OF TOPICS
PRINT THIS ARTICLE
by Arthur Hill
The Nasdaq broke above 2040 with a surge on high volume, but lack of help from the semiconductor group is weighing.
Position: Sell
Arthur Hill
Arthur Hill is currently editor of TDTrader.com, a website specializing in trading strategies, sector/industry specific breadth stats and overall technical analysis. He passed the Society of Technical Analysts (STA London) diploma exam with distinction is a Certified Financial Technician (CFTe). Prior to TD Trader, he was the Chief Technical Analyst for Stockcharts.com and the main contributor to the ChartSchool.
PRINT THIS ARTICLE
Semi's Drag Nasdaq Lower
04/29/04 12:53:22 PMby Arthur Hill
The Nasdaq broke above 2040 with a surge on high volume, but lack of help from the semiconductor group is weighing.
Position: Sell

|
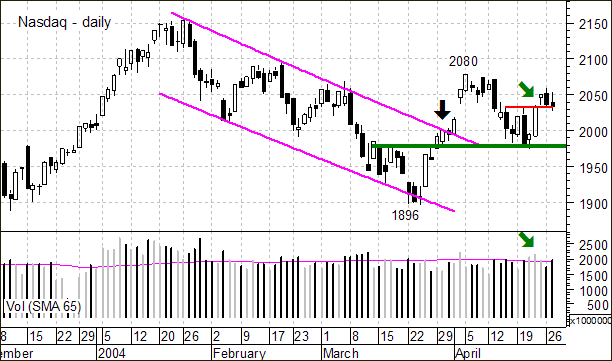
| Figure 1: Chart of the Nasdaq. |
| Graphic provided by: MetaStock. |
| |
| The Nasdaq broke falling price channel resistance with a strong move in late March and early April (black arrow). After a pullback to broken resistance, the index found support around 1980 and advanced above 2040 on strong volume (green arrows). Upside volume on the 22-Apr advance was the highest since 2-Apr and the second highest since 23-Jan. The breakout argues for a continuation of the prior advance (1896 to 2080) and challenge to the January high. |
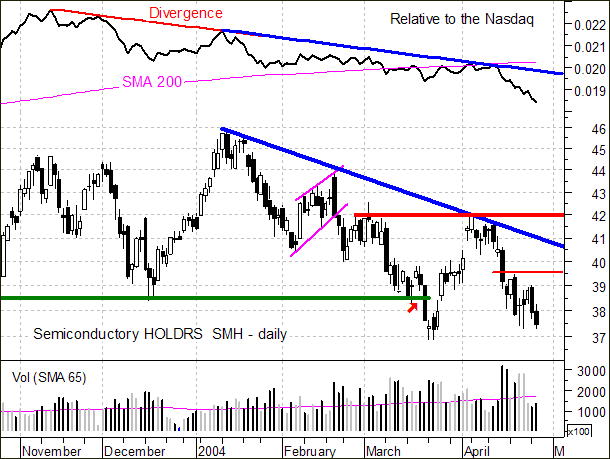
| But wait, something ain't quite right. Despite the breakout above 2040 in the Nasdaq, the Semiconductor HLDRS (SMH) is trading closer to its March low than its March high. The stock participated in the initial advance from late March to early April, but quickly fell back and failed to partake in the advance from April 21 to 23. This lack of participation from such a key group is weighing on the Nasdaq and prevented a move above 2080. |
 Figure 2: Chart of the Semiconductor HLDRS (SMH). The price relative, which is a simple plot of the SMH/Nasdaq ratio, shows that the problem remains. SMH outperforms when the price relative (ratio) moves higher and underperforms when the price relative (ratio) moves lower. A large bearish divergence formed from November to January (red line) and this foreshadowed the January peak in the Nasdaq. The price relative remains in a downtrend and broke below its 200-day simple moving average in early April. Until the price relative forms a bullish divergence or turns higher, SMH is likely to keep pressure on the Nasdaq. |
Arthur Hill is currently editor of TDTrader.com, a website specializing in trading strategies, sector/industry specific breadth stats and overall technical analysis. He passed the Society of Technical Analysts (STA London) diploma exam with distinction is a Certified Financial Technician (CFTe). Prior to TD Trader, he was the Chief Technical Analyst for Stockcharts.com and the main contributor to the ChartSchool.
| Title: | Editor |
| Company: | TDTrader.com |
| Address: | Willem Geetsstraat 17 |
| Mechelen, B2800 | |
| Phone # for sales: | 3215345465 |
| Website: | www.tdtrader.com |
| E-mail address: | arthurh@tdtrader.com |
Traders' Resource Links | |
| TDTrader.com has not added any product or service information to TRADERS' RESOURCE. | |
Click here for more information about our publications!
PRINT THIS ARTICLE

Request Information From Our Sponsors
- StockCharts.com, Inc.
- Candle Patterns
- Candlestick Charting Explained
- Intermarket Technical Analysis
- John Murphy on Chart Analysis
- John Murphy's Chart Pattern Recognition
- John Murphy's Market Message
- MurphyExplainsMarketAnalysis-Intermarket Analysis
- MurphyExplainsMarketAnalysis-Visual Analysis
- StockCharts.com
- Technical Analysis of the Financial Markets
- The Visual Investor
- VectorVest, Inc.
- Executive Premier Workshop
- One-Day Options Course
- OptionsPro
- Retirement Income Workshop
- Sure-Fire Trading Systems (VectorVest, Inc.)
- Trading as a Business Workshop
- VectorVest 7 EOD
- VectorVest 7 RealTime/IntraDay
- VectorVest AutoTester
- VectorVest Educational Services
- VectorVest OnLine
- VectorVest Options Analyzer
- VectorVest ProGraphics v6.0
- VectorVest ProTrader 7
- VectorVest RealTime Derby Tool
- VectorVest Simulator
- VectorVest Variator
- VectorVest Watchdog
