HOT TOPICS LIST
- MACD
- Fibonacci
- RSI
- Gann
- ADXR
- Stochastics
- Volume
- Triangles
- Futures
- Cycles
- Volatility
- ZIGZAG
- MESA
- Retracement
- Aroon
INDICATORS LIST
LIST OF TOPICS
PRINT THIS ARTICLE
by Arthur Hill
Transocean (RIG), a world leader in offshore drilling, broke major resistance in January and the current pullback looks like a classic throwback.
Position: N/A
Arthur Hill
Arthur Hill is currently editor of TDTrader.com, a website specializing in trading strategies, sector/industry specific breadth stats and overall technical analysis. He passed the Society of Technical Analysts (STA London) diploma exam with distinction is a Certified Financial Technician (CFTe). Prior to TD Trader, he was the Chief Technical Analyst for Stockcharts.com and the main contributor to the ChartSchool.
PRINT THIS ARTICLE
TRITOP/TRI BOTTOM
RIG Returns To Resistance Break
04/29/04 07:56:47 AMby Arthur Hill
Transocean (RIG), a world leader in offshore drilling, broke major resistance in January and the current pullback looks like a classic throwback.
Position: N/A

|
| Graphic provided by: MetaStock. |
| |
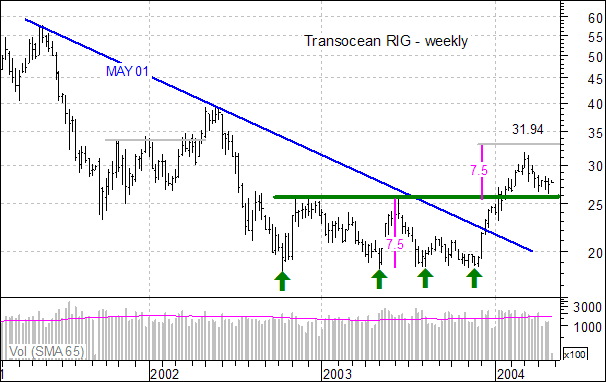
| On the weekly chart, RIG formed a large triple bottom with support at 18.5 and resistance at 26 (green arrows). Actually there are more than three lows around 18.5, but the two intermittent reaction highs validate the triple bottom. The break above resistance occurred with good volume and upside projection was to around 32.5. The length of the pattern (26 - 18.5 = 7.5) is applied to the breakout to obtain a target (26 + 7 = 33). |
| The stock reached 31.94 in early March and fulfilled the target for all intents and purposes. Even though the target was reached and the stock has since declined, the long-term trend remains bullish. Broken resistance often turns into support and this former area of supply is now a source of demand. The decline back to broken resistance is called a throwback. |
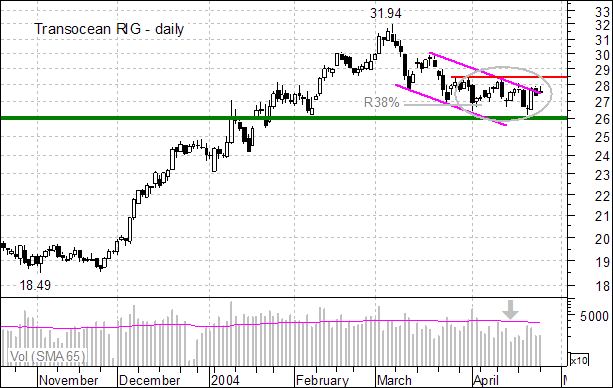
 Figure 2: Daily chart of RIG. The daily chart confirms support around 26. First, the decline retraced a Fibonacci 38% of the prior advance. Second, the decline formed a falling price channel (magenta trendlines). Both the retracement and pattern are typical for corrections. The correction found support as the stock traded flat the first few weeks of April with low volume (gray oval and gray arrow). This looks like the calm before the storm and suggests that the stock is preparing for another move. A move above 29 would signal a continuation of the prior advance (18.5 to 31.94) and a move below 26 would suggest further downside. |
Arthur Hill is currently editor of TDTrader.com, a website specializing in trading strategies, sector/industry specific breadth stats and overall technical analysis. He passed the Society of Technical Analysts (STA London) diploma exam with distinction is a Certified Financial Technician (CFTe). Prior to TD Trader, he was the Chief Technical Analyst for Stockcharts.com and the main contributor to the ChartSchool.
| Title: | Editor |
| Company: | TDTrader.com |
| Address: | Willem Geetsstraat 17 |
| Mechelen, B2800 | |
| Phone # for sales: | 3215345465 |
| Website: | www.tdtrader.com |
| E-mail address: | arthurh@tdtrader.com |
Traders' Resource Links | |
| TDTrader.com has not added any product or service information to TRADERS' RESOURCE. | |
Click here for more information about our publications!
PRINT THIS ARTICLE

Request Information From Our Sponsors
- StockCharts.com, Inc.
- Candle Patterns
- Candlestick Charting Explained
- Intermarket Technical Analysis
- John Murphy on Chart Analysis
- John Murphy's Chart Pattern Recognition
- John Murphy's Market Message
- MurphyExplainsMarketAnalysis-Intermarket Analysis
- MurphyExplainsMarketAnalysis-Visual Analysis
- StockCharts.com
- Technical Analysis of the Financial Markets
- The Visual Investor
- VectorVest, Inc.
- Executive Premier Workshop
- One-Day Options Course
- OptionsPro
- Retirement Income Workshop
- Sure-Fire Trading Systems (VectorVest, Inc.)
- Trading as a Business Workshop
- VectorVest 7 EOD
- VectorVest 7 RealTime/IntraDay
- VectorVest AutoTester
- VectorVest Educational Services
- VectorVest OnLine
- VectorVest Options Analyzer
- VectorVest ProGraphics v6.0
- VectorVest ProTrader 7
- VectorVest RealTime Derby Tool
- VectorVest Simulator
- VectorVest Variator
- VectorVest Watchdog
