HOT TOPICS LIST
- MACD
- Fibonacci
- RSI
- Gann
- ADXR
- Stochastics
- Volume
- Triangles
- Futures
- Cycles
- Volatility
- ZIGZAG
- MESA
- Retracement
- Aroon
INDICATORS LIST
LIST OF TOPICS
PRINT THIS ARTICLE
by Luis Ferro
The yen has displayed volatile behavior lately, leading to the formation of two consecutive island reversals. While the short-term forecast is bearish, the long-term uptrend should still be considered intact.
Position: Sell
Luis Ferro
Trader and technical analyst living in Bern, Switzerland. A full member of the STA, currently enrolled in the DITA program and the CMT program.
PRINT THIS ARTICLE
ISLAND REVERSAL
Island Reversal In Yen Futures
04/26/04 11:34:46 AMby Luis Ferro
The yen has displayed volatile behavior lately, leading to the formation of two consecutive island reversals. While the short-term forecast is bearish, the long-term uptrend should still be considered intact.
Position: Sell
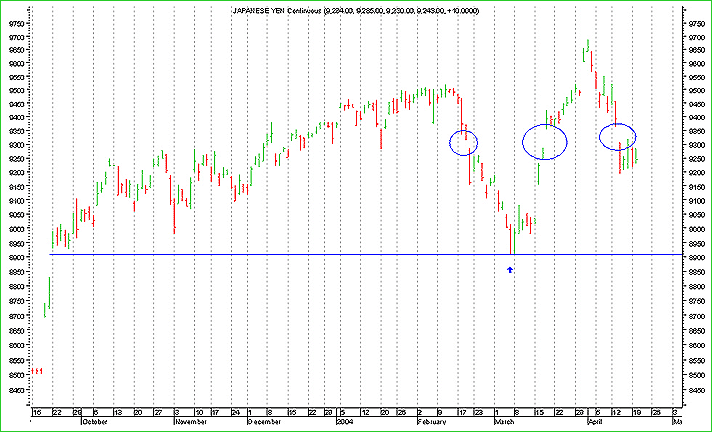
| In the daily chart of the yen, you can see that after a prolonged uptrend, the yen reached a top of 9518 in February and then started a corrective movement only stopping at 8905. During this movement a gap at the 9300 level occurred. After finding support at 8905, the yen climbed very fast, again gapping through the 9300 level and therefore creating an island reversal pattern. This formation predicted higher prices and indeed the yen kept rising until it reached 9688. |

|
| Figure 1: Daily chart of the yen. |
| Graphic provided by: MetaStock. |
| |
| This was the top of the movement and once more the yen started a correction. For the third time prices gapped through the 9300 level, creating a second island reversal pattern, but this time with bearish implications. The formation of various consecutive island reversals with gaps at the same level, while not an everyday occurrence, is a much more frequent phenomenon that you might expect. |
| This second island reversal pattern dominates the forecast for the short-term. You can calculate a price objective by measuring the height of the pattern, and subtracting this result from the level at which the gap occurred. In this case the price objective is 9300 - (9688 - 9300) = 8912. This is the minimum price objective for the yen and it is very close to the low of the previous corrective movement. It was also at this level that the strong gap of September 2003 occurred, and this example demonstrates how a gap's influence can extend for a long time and define very important support and resistance levels. |
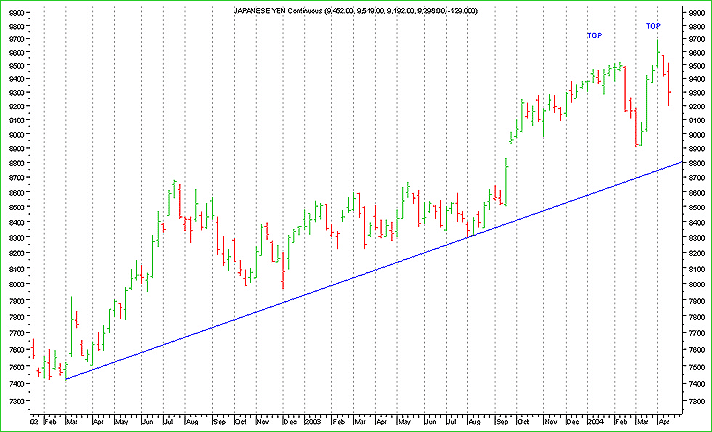
 Figure 2: Weekly chart of the yen. While the forecast for the short-term trend is bearish, the longer term uptrend can still be considered in place, as can be seen in the weekly chart. However, if support at 8900 is broken, a double top will form, and at the same time, a penetration of the trendline will probably take place. Only if this happens, can we consider that the long-term trend has changed and expect still lower prices for the yen. |
Trader and technical analyst living in Bern, Switzerland. A full member of the STA, currently enrolled in the DITA program and the CMT program.
| Address: | Switzerland |
| E-mail address: | luispgsf@yahoo.com |
Click here for more information about our publications!
Comments
Date: 04/26/04Rank: 5Comment:

Request Information From Our Sponsors
- StockCharts.com, Inc.
- Candle Patterns
- Candlestick Charting Explained
- Intermarket Technical Analysis
- John Murphy on Chart Analysis
- John Murphy's Chart Pattern Recognition
- John Murphy's Market Message
- MurphyExplainsMarketAnalysis-Intermarket Analysis
- MurphyExplainsMarketAnalysis-Visual Analysis
- StockCharts.com
- Technical Analysis of the Financial Markets
- The Visual Investor
- VectorVest, Inc.
- Executive Premier Workshop
- One-Day Options Course
- OptionsPro
- Retirement Income Workshop
- Sure-Fire Trading Systems (VectorVest, Inc.)
- Trading as a Business Workshop
- VectorVest 7 EOD
- VectorVest 7 RealTime/IntraDay
- VectorVest AutoTester
- VectorVest Educational Services
- VectorVest OnLine
- VectorVest Options Analyzer
- VectorVest ProGraphics v6.0
- VectorVest ProTrader 7
- VectorVest RealTime Derby Tool
- VectorVest Simulator
- VectorVest Variator
- VectorVest Watchdog
