HOT TOPICS LIST
- MACD
- Fibonacci
- RSI
- Gann
- ADXR
- Stochastics
- Volume
- Triangles
- Futures
- Cycles
- Volatility
- ZIGZAG
- MESA
- Retracement
- Aroon
INDICATORS LIST
LIST OF TOPICS
PRINT THIS ARTICLE
by Arthur Hill
Coca-Cola (KO) sports a long-long term falling wedge breakout confirmed by MACD.
Position: Buy
Arthur Hill
Arthur Hill is currently editor of TDTrader.com, a website specializing in trading strategies, sector/industry specific breadth stats and overall technical analysis. He passed the Society of Technical Analysts (STA London) diploma exam with distinction is a Certified Financial Technician (CFTe). Prior to TD Trader, he was the Chief Technical Analyst for Stockcharts.com and the main contributor to the ChartSchool.
PRINT THIS ARTICLE
WEDGE FORMATIONS
Coca-Cola Breaks Falling Wedge Trendline
04/23/04 09:20:01 AMby Arthur Hill
Coca-Cola (KO) sports a long-long term falling wedge breakout confirmed by MACD.
Position: Buy
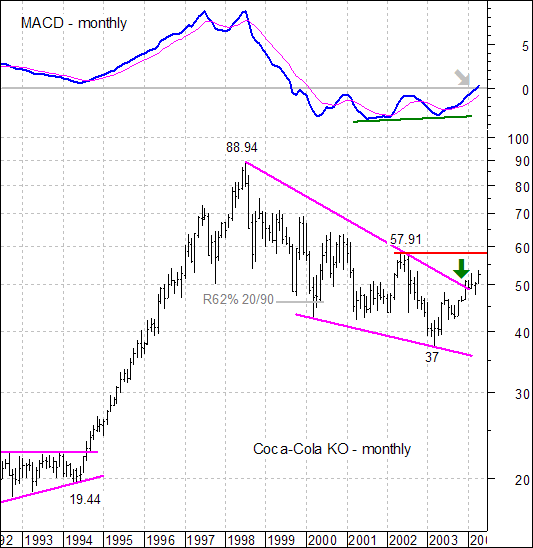
| Starting with the monthly chart, KO advanced from April 1994 to July 1998. The move was quite spectacular as the stock quadrupled in price. Such strong advances are usually followed by a correction and KO was no different. The stock retraced over 62% of its prior advance with a long falling wedge that extends from July 1998 to March 2003. The correction lasted longer than the actual advance. Corrections are usually shorter in both time and depth, but the pattern (falling wedge) looks robust. |

|
| Figure 1: Monthly chart of Coca-Cola. |
| Graphic provided by: MetaStock. |
| |
| KO broke above the upper trendline with a strong move over the last few months and this is the first step to a continuation higher and trend change. The second step would be a higher high above resistance at 58 and the third step would be a higher low or successful test above the prior low at 37. A trendline break, higher high and higher low would complete a trend change and argue for a continuation of the prior advance (Apr-94 to Jul-98). |
| MACD predicted and then confirmed strength in KO. This is the normal MACD (12-period EMA less the 26-period EMA) with a 9-period EMA for a signal line. In this case, the periods are months. MACD formed a bullish divergence with a higher low in March 2003 (green line). The subsequent signal line crossover confirmed the divergence and the follow-through into positive territory (gray arrow) makes MACD fully bullish. Notice that this the first time in over four years that MACD has been in positive territory. |
Arthur Hill is currently editor of TDTrader.com, a website specializing in trading strategies, sector/industry specific breadth stats and overall technical analysis. He passed the Society of Technical Analysts (STA London) diploma exam with distinction is a Certified Financial Technician (CFTe). Prior to TD Trader, he was the Chief Technical Analyst for Stockcharts.com and the main contributor to the ChartSchool.
| Title: | Editor |
| Company: | TDTrader.com |
| Address: | Willem Geetsstraat 17 |
| Mechelen, B2800 | |
| Phone # for sales: | 3215345465 |
| Website: | www.tdtrader.com |
| E-mail address: | arthurh@tdtrader.com |
Traders' Resource Links | |
| TDTrader.com has not added any product or service information to TRADERS' RESOURCE. | |
Click here for more information about our publications!
Comments
Date: 04/23/04Rank: 5Comment:
Date: 08/15/04Rank: Comment: can you help me with australian stocks

Request Information From Our Sponsors
- StockCharts.com, Inc.
- Candle Patterns
- Candlestick Charting Explained
- Intermarket Technical Analysis
- John Murphy on Chart Analysis
- John Murphy's Chart Pattern Recognition
- John Murphy's Market Message
- MurphyExplainsMarketAnalysis-Intermarket Analysis
- MurphyExplainsMarketAnalysis-Visual Analysis
- StockCharts.com
- Technical Analysis of the Financial Markets
- The Visual Investor
- VectorVest, Inc.
- Executive Premier Workshop
- One-Day Options Course
- OptionsPro
- Retirement Income Workshop
- Sure-Fire Trading Systems (VectorVest, Inc.)
- Trading as a Business Workshop
- VectorVest 7 EOD
- VectorVest 7 RealTime/IntraDay
- VectorVest AutoTester
- VectorVest Educational Services
- VectorVest OnLine
- VectorVest Options Analyzer
- VectorVest ProGraphics v6.0
- VectorVest ProTrader 7
- VectorVest RealTime Derby Tool
- VectorVest Simulator
- VectorVest Variator
- VectorVest Watchdog
