HOT TOPICS LIST
- MACD
- Fibonacci
- RSI
- Gann
- ADXR
- Stochastics
- Volume
- Triangles
- Futures
- Cycles
- Volatility
- ZIGZAG
- MESA
- Retracement
- Aroon
INDICATORS LIST
LIST OF TOPICS
PRINT THIS ARTICLE
by Arthur Hill
With the prospects of higher interest rates on the horizon, key banking stocks like State Street (STT) could come under selling pressure.
Position: Hold
Arthur Hill
Arthur Hill is currently editor of TDTrader.com, a website specializing in trading strategies, sector/industry specific breadth stats and overall technical analysis. He passed the Society of Technical Analysts (STA London) diploma exam with distinction is a Certified Financial Technician (CFTe). Prior to TD Trader, he was the Chief Technical Analyst for Stockcharts.com and the main contributor to the ChartSchool.
PRINT THIS ARTICLE
HEAD & SHOULDERS
State Street Forms Large Head And Shoulders Reversal
04/16/04 09:16:57 AMby Arthur Hill
With the prospects of higher interest rates on the horizon, key banking stocks like State Street (STT) could come under selling pressure.
Position: Hold
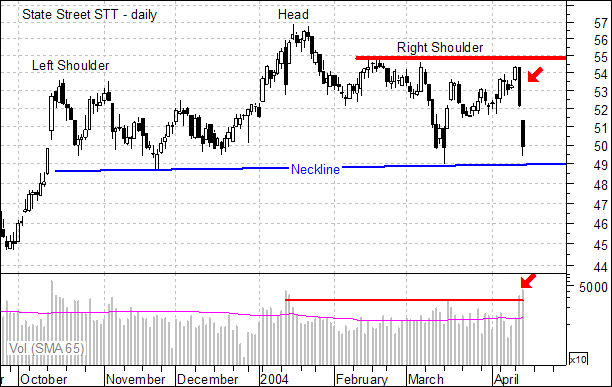
| While this fundamental argument makes sense and is good dinner party chatter, the price chart holds the true key and State Street (STT) is forming a large head and shoulders reversal. The stock has been trading flat since mid-October as this distribution pattern strings out. The left shoulder formed in October/November, the head in January and the right shoulder is currently under construction. |

|
| Figure 1: Daily chart of State Street. |
| Graphic provided by: MetaStock. |
| |
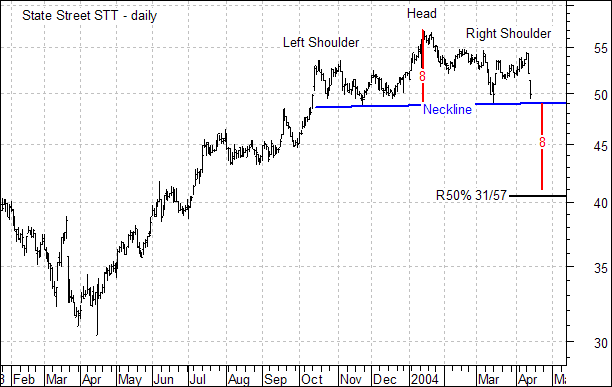
| Keep in mind that a head and shoulders pattern is only a "potential" reversal pattern until confirmed. Neckline support extends from the November and March lows to mark support around 49. A close below 49 would confirm the pattern and project further weakness to around 41 (57 - 49 = 8, 49 - 8 = 41). As long as neckline support holds, the stock remains in a trading range at worst. |
 Figure 2: Larger view of the head and shoulder formation on State Street's daily chart. A move above 55 would negate the prospects of a head and shoulders reversal. The stock met resistance between 54 and 55 three times in the last three months. The most recent attempt to break above 55 was repelled with a long black candlestick on the highest volume since mid-January (Figure 1, red arrows). A recovery from such selling pressure AND a move above 55 would be most bullish and suggest further upside. |
Arthur Hill is currently editor of TDTrader.com, a website specializing in trading strategies, sector/industry specific breadth stats and overall technical analysis. He passed the Society of Technical Analysts (STA London) diploma exam with distinction is a Certified Financial Technician (CFTe). Prior to TD Trader, he was the Chief Technical Analyst for Stockcharts.com and the main contributor to the ChartSchool.
| Title: | Editor |
| Company: | TDTrader.com |
| Address: | Willem Geetsstraat 17 |
| Mechelen, B2800 | |
| Phone # for sales: | 3215345465 |
| Website: | www.tdtrader.com |
| E-mail address: | arthurh@tdtrader.com |
Traders' Resource Links | |
| TDTrader.com has not added any product or service information to TRADERS' RESOURCE. | |
Click here for more information about our publications!
PRINT THIS ARTICLE

Request Information From Our Sponsors
- StockCharts.com, Inc.
- Candle Patterns
- Candlestick Charting Explained
- Intermarket Technical Analysis
- John Murphy on Chart Analysis
- John Murphy's Chart Pattern Recognition
- John Murphy's Market Message
- MurphyExplainsMarketAnalysis-Intermarket Analysis
- MurphyExplainsMarketAnalysis-Visual Analysis
- StockCharts.com
- Technical Analysis of the Financial Markets
- The Visual Investor
- VectorVest, Inc.
- Executive Premier Workshop
- One-Day Options Course
- OptionsPro
- Retirement Income Workshop
- Sure-Fire Trading Systems (VectorVest, Inc.)
- Trading as a Business Workshop
- VectorVest 7 EOD
- VectorVest 7 RealTime/IntraDay
- VectorVest AutoTester
- VectorVest Educational Services
- VectorVest OnLine
- VectorVest Options Analyzer
- VectorVest ProGraphics v6.0
- VectorVest ProTrader 7
- VectorVest RealTime Derby Tool
- VectorVest Simulator
- VectorVest Variator
- VectorVest Watchdog
