HOT TOPICS LIST
- MACD
- Fibonacci
- RSI
- Gann
- ADXR
- Stochastics
- Volume
- Triangles
- Futures
- Cycles
- Volatility
- ZIGZAG
- MESA
- Retracement
- Aroon
INDICATORS LIST
LIST OF TOPICS
PRINT THIS ARTICLE
by Arthur Hill
Even though Dow and Dupont are the two biggest components of the Materials SPDR (XLB), recent weakness in Alcoa (AA) is pulling the sector lower.
Position: Sell
Arthur Hill
Arthur Hill is currently editor of TDTrader.com, a website specializing in trading strategies, sector/industry specific breadth stats and overall technical analysis. He passed the Society of Technical Analysts (STA London) diploma exam with distinction is a Certified Financial Technician (CFTe). Prior to TD Trader, he was the Chief Technical Analyst for Stockcharts.com and the main contributor to the ChartSchool.
PRINT THIS ARTICLE
TRIANGLES
Alcoa Drags Materials Lower
04/15/04 08:38:07 AMby Arthur Hill
Even though Dow and Dupont are the two biggest components of the Materials SPDR (XLB), recent weakness in Alcoa (AA) is pulling the sector lower.
Position: Sell
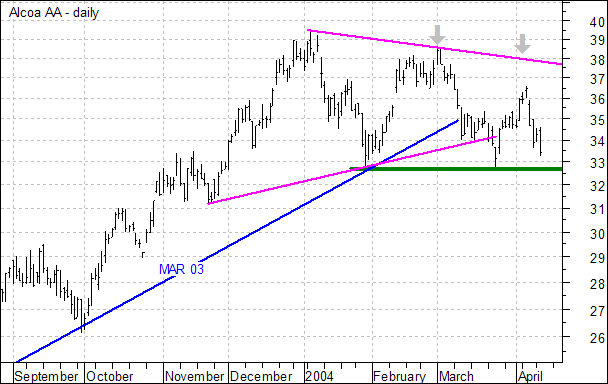
| Alcoa is the third largest component and makes up over 9% of the Materials SPDR (XLB). There are two patterns at work and one has already been confirmed as bearish. First, the stock formed a large symmetrical triangle over the last few months (magenta trendlines) and broke the lower trendline in late March. This was negative, but AA bounced off support from the late January low and moved back above 35 for an immediate challenge. |

|
| Figure 1: Daily chart of Alcoa. |
| Graphic provided by: MetaStock. |
| |
| The second pattern is a large descending triangle marked by the upper magenta trendline and green support line. Notice the lower lows over the last two months (gray arrows). These show selling pressure at lower and lower prices as buyers are unable to push prices above the prior high. Support around 33 represents demand's final stand. A close below this support line would signal a victory by supply, confirm the descending triangle and argue for further weakness below 30. |
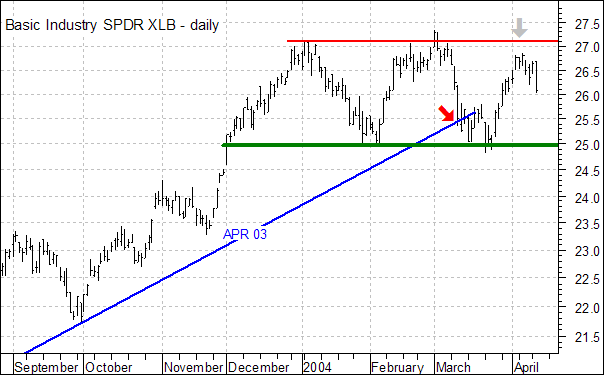
 Figure 2: Chart of XLB. The Materials SPDR (XLB) advanced from 17 to 27 (Mar-03 to Jan-04) and then formed a large rectangle/consolidation over the last few months. The stock broke above resistance briefly in early March, but this breakout quickly failed and the subsequent decline broke below the April trendline (red arrow). This was the first warning sign and the stock appears to have formed a lower high in early April (gray arrow), thanks in part to AA. A close below key support at 25 would break the large rectangle and turn the trend bearish for XLB. |
Arthur Hill is currently editor of TDTrader.com, a website specializing in trading strategies, sector/industry specific breadth stats and overall technical analysis. He passed the Society of Technical Analysts (STA London) diploma exam with distinction is a Certified Financial Technician (CFTe). Prior to TD Trader, he was the Chief Technical Analyst for Stockcharts.com and the main contributor to the ChartSchool.
| Title: | Editor |
| Company: | TDTrader.com |
| Address: | Willem Geetsstraat 17 |
| Mechelen, B2800 | |
| Phone # for sales: | 3215345465 |
| Website: | www.tdtrader.com |
| E-mail address: | arthurh@tdtrader.com |
Traders' Resource Links | |
| TDTrader.com has not added any product or service information to TRADERS' RESOURCE. | |
Click here for more information about our publications!
Comments
Date: 04/20/04Rank: 5Comment:

Request Information From Our Sponsors
- StockCharts.com, Inc.
- Candle Patterns
- Candlestick Charting Explained
- Intermarket Technical Analysis
- John Murphy on Chart Analysis
- John Murphy's Chart Pattern Recognition
- John Murphy's Market Message
- MurphyExplainsMarketAnalysis-Intermarket Analysis
- MurphyExplainsMarketAnalysis-Visual Analysis
- StockCharts.com
- Technical Analysis of the Financial Markets
- The Visual Investor
- VectorVest, Inc.
- Executive Premier Workshop
- One-Day Options Course
- OptionsPro
- Retirement Income Workshop
- Sure-Fire Trading Systems (VectorVest, Inc.)
- Trading as a Business Workshop
- VectorVest 7 EOD
- VectorVest 7 RealTime/IntraDay
- VectorVest AutoTester
- VectorVest Educational Services
- VectorVest OnLine
- VectorVest Options Analyzer
- VectorVest ProGraphics v6.0
- VectorVest ProTrader 7
- VectorVest RealTime Derby Tool
- VectorVest Simulator
- VectorVest Variator
- VectorVest Watchdog
