HOT TOPICS LIST
- MACD
- Fibonacci
- RSI
- Gann
- ADXR
- Stochastics
- Volume
- Triangles
- Futures
- Cycles
- Volatility
- ZIGZAG
- MESA
- Retracement
- Aroon
INDICATORS LIST
LIST OF TOPICS
PRINT THIS ARTICLE
by Arthur Hill
The S&P Small Cap Index ($SML) remains in a clear uptrend, but a reversal pattern could be taking shape.
Position: Hold
Arthur Hill
Arthur Hill is currently editor of TDTrader.com, a website specializing in trading strategies, sector/industry specific breadth stats and overall technical analysis. He passed the Society of Technical Analysts (STA London) diploma exam with distinction is a Certified Financial Technician (CFTe). Prior to TD Trader, he was the Chief Technical Analyst for Stockcharts.com and the main contributor to the ChartSchool.
PRINT THIS ARTICLE
BROADENING FORMATION
Competing Patterns In The S&P Small Cap Index
04/08/04 08:59:42 AMby Arthur Hill
The S&P Small Cap Index ($SML) remains in a clear uptrend, but a reversal pattern could be taking shape.
Position: Hold
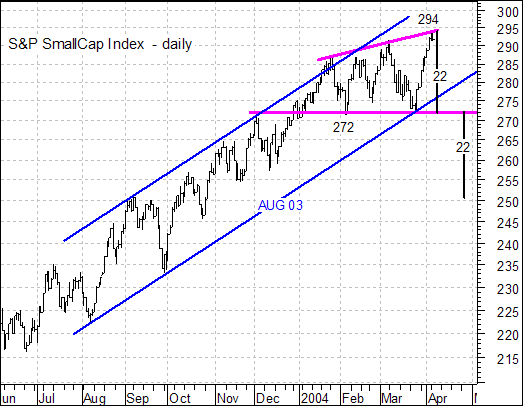
| First and foremost, the current trend is clearly bullish with higher highs and higher lows. A trendline extending up from Aug-03 has been touched three times, with the most recent bounce in late March. By drawing a parallel line above this one, a rising price channel evolves and the trend is firmly bullish as long as this channel holds. |

|
| Graphic provided by: MetaStock. |
| |
| Even though the rising price channel dominates the landscape, a long-winded reversal pattern appears to be forming. From the Encyclopedia of Chart Patterns, Thomas Bulkowski refers to this as a "right-angled" and "ascending broadening formation." The magenta trendlines shows equal lows in February and March as well as rising highs in January, March, and now April. The black vertical line from 294 extends down to support to give the pattern a right-angle. |
| According to Bulkowski, these are bearish reversal patterns that can last up to three months. The current pattern is entering its fourth month. Confirmation would come with a support break at 272 and the projected decline would go to around 250 (295 - 272 = 23, 272 - 23 = 249). The height of the pattern is subtracted from the breakout to find a target. As long as the index remains above support at 272, the pattern is confirmed and the trend remains bullish. |
Arthur Hill is currently editor of TDTrader.com, a website specializing in trading strategies, sector/industry specific breadth stats and overall technical analysis. He passed the Society of Technical Analysts (STA London) diploma exam with distinction is a Certified Financial Technician (CFTe). Prior to TD Trader, he was the Chief Technical Analyst for Stockcharts.com and the main contributor to the ChartSchool.
| Title: | Editor |
| Company: | TDTrader.com |
| Address: | Willem Geetsstraat 17 |
| Mechelen, B2800 | |
| Phone # for sales: | 3215345465 |
| Website: | www.tdtrader.com |
| E-mail address: | arthurh@tdtrader.com |
Traders' Resource Links | |
| TDTrader.com has not added any product or service information to TRADERS' RESOURCE. | |
Click here for more information about our publications!
PRINT THIS ARTICLE

|

Request Information From Our Sponsors
- StockCharts.com, Inc.
- Candle Patterns
- Candlestick Charting Explained
- Intermarket Technical Analysis
- John Murphy on Chart Analysis
- John Murphy's Chart Pattern Recognition
- John Murphy's Market Message
- MurphyExplainsMarketAnalysis-Intermarket Analysis
- MurphyExplainsMarketAnalysis-Visual Analysis
- StockCharts.com
- Technical Analysis of the Financial Markets
- The Visual Investor
- VectorVest, Inc.
- Executive Premier Workshop
- One-Day Options Course
- OptionsPro
- Retirement Income Workshop
- Sure-Fire Trading Systems (VectorVest, Inc.)
- Trading as a Business Workshop
- VectorVest 7 EOD
- VectorVest 7 RealTime/IntraDay
- VectorVest AutoTester
- VectorVest Educational Services
- VectorVest OnLine
- VectorVest Options Analyzer
- VectorVest ProGraphics v6.0
- VectorVest ProTrader 7
- VectorVest RealTime Derby Tool
- VectorVest Simulator
- VectorVest Variator
- VectorVest Watchdog
