

HOT TOPICS LIST
- MACD
- Fibonacci
- RSI
- Gann
- ADXR
- Stochastics
- Volume
- Triangles
- Futures
- Cycles
- Volatility
- ZIGZAG
- MESA
- Retracement
- Aroon
INDICATORS LIST
LIST OF TOPICS
PRINT THIS ARTICLE
by Arthur Hill
Sandisk (SNDK) held support in February and looks poised to break resistance, but low volume still haunts the stock.
Position: Buy
Arthur Hill
Arthur Hill is currently editor of TDTrader.com, a website specializing in trading strategies, sector/industry specific breadth stats and overall technical analysis. He passed the Society of Technical Analysts (STA London) diploma exam with distinction is a Certified Financial Technician (CFTe). Prior to TD Trader, he was the Chief Technical Analyst for Stockcharts.com and the main contributor to the ChartSchool.
PRINT THIS ARTICLE
CHART ANALYSIS
Sandisk On The Verge Of A Breakout
04/02/04 01:35:07 PMby Arthur Hill
Sandisk (SNDK) held support in February and looks poised to break resistance, but low volume still haunts the stock.
Position: Buy
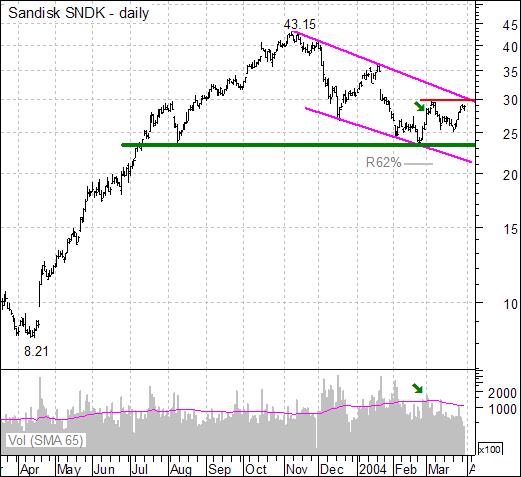
| While the Nasdaq moved to new reaction lows in March, SNDK held above its February low and started showing good relative strength, or rather less weakness than the Nasdaq. The stock found support at 23.5 from the August low and bounced with a volume surge in late February and early March (green arrow). |
|
| Figure 1: One year daily chart of Sandisk. |
| Graphic provided by: MetaStock. |
| |
| Despite this bounce, the stock remains in a medium-term downtrend that is defined by a falling price channel (magenta trendlines). This decline retraced 50-62% of the prior advance (8.21 to 43.15). Both the size of the retracement and pattern are typical for corrections. However, a continuation higher would not be signaled unless the stock breaks above resistance at 30 (red line). This level is confirmed by the trendline extending down from 43.15 and the early March reaction high. |
 Figure 2: Sandisk daily chart with RSI and Chaikin money flow. Indicators point to a pending break, but low volume is a concern. Chaikin money flow, which measures the daily close relative to the high/low range and incorporates volume, formed a bullish divergence in February and is flirting with the zero line. A move above .10 would break the early March high and turn signs of accumulation into actual buying pressure. Similarly, RSI formed a bearish divergence in February and recently moved above 50. Further strength above 60 would break the prior highs and signal a momentum breakout. The lone caveat remains absolute volume, which has been low over the last few weeks. For a breakout to be considered robust, the stock needs to move above 30 on above average volume. |
Arthur Hill is currently editor of TDTrader.com, a website specializing in trading strategies, sector/industry specific breadth stats and overall technical analysis. He passed the Society of Technical Analysts (STA London) diploma exam with distinction is a Certified Financial Technician (CFTe). Prior to TD Trader, he was the Chief Technical Analyst for Stockcharts.com and the main contributor to the ChartSchool.
| Title: | Editor |
| Company: | TDTrader.com |
| Address: | Willem Geetsstraat 17 |
| Mechelen, B2800 | |
| Phone # for sales: | 3215345465 |
| Website: | www.tdtrader.com |
| E-mail address: | arthurh@tdtrader.com |
Traders' Resource Links | |
| TDTrader.com has not added any product or service information to TRADERS' RESOURCE. | |
Click here for more information about our publications!
Comments
Date:�04/06/04Rank:�5Comment:�
Date:�04/06/04Rank:�5Comment:�

Request Information From Our Sponsors
- StockCharts.com, Inc.
- Candle Patterns
- Candlestick Charting Explained
- Intermarket Technical Analysis
- John Murphy on Chart Analysis
- John Murphy's Chart Pattern Recognition
- John Murphy's Market Message
- MurphyExplainsMarketAnalysis-Intermarket Analysis
- MurphyExplainsMarketAnalysis-Visual Analysis
- StockCharts.com
- Technical Analysis of the Financial Markets
- The Visual Investor
- VectorVest, Inc.
- Executive Premier Workshop
- One-Day Options Course
- OptionsPro
- Retirement Income Workshop
- Sure-Fire Trading Systems (VectorVest, Inc.)
- Trading as a Business Workshop
- VectorVest 7 EOD
- VectorVest 7 RealTime/IntraDay
- VectorVest AutoTester
- VectorVest Educational Services
- VectorVest OnLine
- VectorVest Options Analyzer
- VectorVest ProGraphics v6.0
- VectorVest ProTrader 7
- VectorVest RealTime Derby Tool
- VectorVest Simulator
- VectorVest Variator
- VectorVest Watchdog