HOT TOPICS LIST
- MACD
- Fibonacci
- RSI
- Gann
- ADXR
- Stochastics
- Volume
- Triangles
- Futures
- Cycles
- Volatility
- ZIGZAG
- MESA
- Retracement
- Aroon
INDICATORS LIST
LIST OF TOPICS
PRINT THIS ARTICLE
by Arthur Hill
Stocks and bonds have been moving in unison since late summer, but signs of strain are starting to appear in this "positive" relationship.
Position: N/A
Arthur Hill
Arthur Hill is currently editor of TDTrader.com, a website specializing in trading strategies, sector/industry specific breadth stats and overall technical analysis. He passed the Society of Technical Analysts (STA London) diploma exam with distinction is a Certified Financial Technician (CFTe). Prior to TD Trader, he was the Chief Technical Analyst for Stockcharts.com and the main contributor to the ChartSchool.
PRINT THIS ARTICLE
STOCKS
Stocks And Bonds Start To Decouple
04/02/04 01:36:40 PMby Arthur Hill
Stocks and bonds have been moving in unison since late summer, but signs of strain are starting to appear in this "positive" relationship.
Position: N/A

|
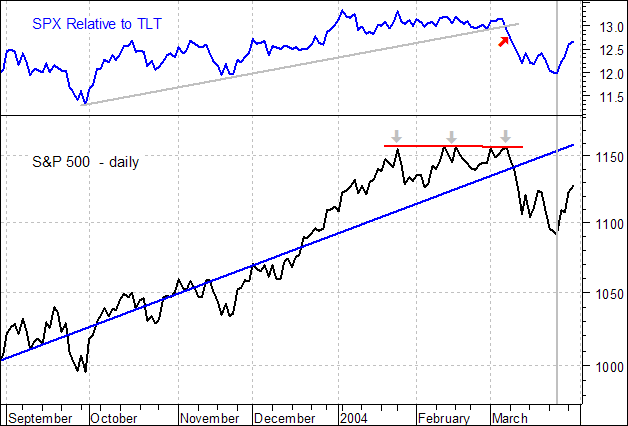
| Figure 1: Daily chart of the S&P 500. |
| Graphic provided by: MetaStock. |
| |
| The first chart shows the S&P 500 (close only) with a linear regression line (blue line). Even though the index is trading below the linear regression line, the line is trending higher and the overall trend for SPX is up. The plot above SPX (blue line) shows the S&P 500 relative to the iShares 20-Year Treasury Fund (TLT). SPX outperformed TLT on a consistent basis from late September until early March. This period of outperformance ended when SPX declined and TLT advanced in early March (red arrow). |
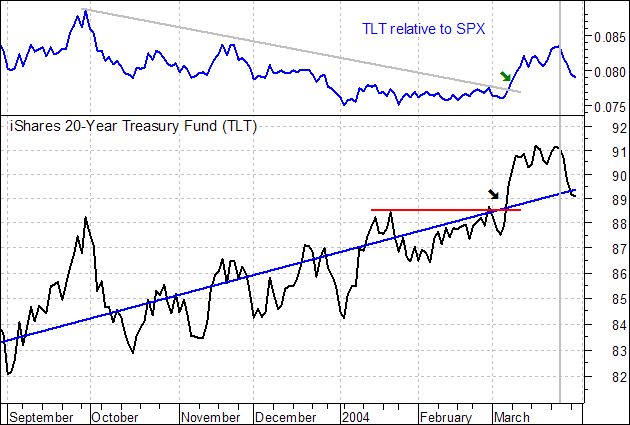
 Figure 2: Daily chart of the TLT. The second chart shows the iShares 20-Year Treasury Fund (TLT - close only) with a linear regression line (blue line). Even though TLT recently broke below the linear regression line, the line is trending higher and the overall trend for TLT is up. Relative to the S&P 500, TLT underperformed from late September to early March. This relative performance line is a mirror image of the one shown in the SPX chart above. As such, we can see that TLT began to outperform SPX in early March (green arrow). |
| The decoupling started with SPX weakness in early March and continued with SPX strength in late March. Notice that SPX met resistance from its January high in February and early March (gray arrows), while TLT broke above resistance and moved to new highs (black arrow). Later in March, SPX advanced sharply and TLT declined sharply (gray vertical line). What does this decoupling imply? The March advance in bonds and decline in stocks was attributed to "terrorist" concerns and a flight to quality. These concerns appear to have subsided and the recent decline in bonds may relate to continued signs of economic strength. This would also explain the recent rise in the S&P 500, which would cheer economic strength. Bonds, however, would view economic strength as a sign that the next move in interest rates will be up and consequently decline. |
Arthur Hill is currently editor of TDTrader.com, a website specializing in trading strategies, sector/industry specific breadth stats and overall technical analysis. He passed the Society of Technical Analysts (STA London) diploma exam with distinction is a Certified Financial Technician (CFTe). Prior to TD Trader, he was the Chief Technical Analyst for Stockcharts.com and the main contributor to the ChartSchool.
| Title: | Editor |
| Company: | TDTrader.com |
| Address: | Willem Geetsstraat 17 |
| Mechelen, B2800 | |
| Phone # for sales: | 3215345465 |
| Website: | www.tdtrader.com |
| E-mail address: | arthurh@tdtrader.com |
Traders' Resource Links | |
| TDTrader.com has not added any product or service information to TRADERS' RESOURCE. | |
Click here for more information about our publications!
Comments
Date: 04/06/04Rank: 5Comment:

Request Information From Our Sponsors
- StockCharts.com, Inc.
- Candle Patterns
- Candlestick Charting Explained
- Intermarket Technical Analysis
- John Murphy on Chart Analysis
- John Murphy's Chart Pattern Recognition
- John Murphy's Market Message
- MurphyExplainsMarketAnalysis-Intermarket Analysis
- MurphyExplainsMarketAnalysis-Visual Analysis
- StockCharts.com
- Technical Analysis of the Financial Markets
- The Visual Investor
- VectorVest, Inc.
- Executive Premier Workshop
- One-Day Options Course
- OptionsPro
- Retirement Income Workshop
- Sure-Fire Trading Systems (VectorVest, Inc.)
- Trading as a Business Workshop
- VectorVest 7 EOD
- VectorVest 7 RealTime/IntraDay
- VectorVest AutoTester
- VectorVest Educational Services
- VectorVest OnLine
- VectorVest Options Analyzer
- VectorVest ProGraphics v6.0
- VectorVest ProTrader 7
- VectorVest RealTime Derby Tool
- VectorVest Simulator
- VectorVest Variator
- VectorVest Watchdog
