HOT TOPICS LIST
- MACD
- Fibonacci
- RSI
- Gann
- ADXR
- Stochastics
- Volume
- Triangles
- Futures
- Cycles
- Volatility
- ZIGZAG
- MESA
- Retracement
- Aroon
INDICATORS LIST
LIST OF TOPICS
PRINT THIS ARTICLE
by Arthur Hill
The Australian All Ords Index ($AORD) has been one of the top performers over the last 12 months, but the index just met a major resistance level with slowing momentum.
Position: N/A
Arthur Hill
Arthur Hill is currently editor of TDTrader.com, a website specializing in trading strategies, sector/industry specific breadth stats and overall technical analysis. He passed the Society of Technical Analysts (STA London) diploma exam with distinction is a Certified Financial Technician (CFTe). Prior to TD Trader, he was the Chief Technical Analyst for Stockcharts.com and the main contributor to the ChartSchool.
PRINT THIS ARTICLE
CHART ANALYSIS
All Ords Looking Toppy
03/25/04 10:32:59 AMby Arthur Hill
The Australian All Ords Index ($AORD) has been one of the top performers over the last 12 months, but the index just met a major resistance level with slowing momentum.
Position: N/A
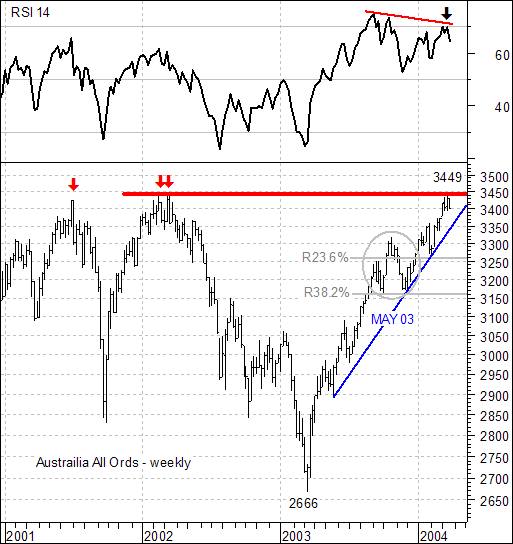
| AORD advanced from 2666 to 3449 over the last 12 months. Given the global stock advance during this period, it may not seem like such a big deal. However, the index forged an all time high this month, which is a big deal. For reference, the S&P 500 would have to advance over 40% to exceed its all time high at 1553 and the Nasdaq Composite would need to advance over 170% to exceed its all time high at 5132. |

|
| Figure 1: Australian All Ords weekly index. |
| Graphic provided by: MetaStock. |
| |
| On the weekly chart, the index is still trading near resistance around 3450 from its Jun-01, Feb-02 and Mar-02 reaction highs (red arrows). Except for a consolidation in the third quarter of 2003 (gray oval), the advance is pretty much straight up. There is a trendline extending up from the May-03 low that has been touched three times and the index has yet to break. A move below the trendline would be the first sign of trouble and would open the door to at least a correction. Looking at the Fibonacci retracements (23.6% and 38.2%), a correction from current levels could extend to 3160 - 3260. This support area is confirmed by the consolidation as well. |
| Why think correction when the trend is clearly bullish? First, the index is overextended because of the almost vertical advance. Second, AORD is trading near resistance that turned back the index in the past. Third, 14-week RSI became overbought in Sep-03 and formed a bearish divergence. Momentum still favors the bulls, but this lower high (black arrow) shows less upside momentum than on the prior advance. With RSI showing less "umph" than before, traders should be on guard for a trendline break (currently 3350) that could lead to a deeper correction. |
Arthur Hill is currently editor of TDTrader.com, a website specializing in trading strategies, sector/industry specific breadth stats and overall technical analysis. He passed the Society of Technical Analysts (STA London) diploma exam with distinction is a Certified Financial Technician (CFTe). Prior to TD Trader, he was the Chief Technical Analyst for Stockcharts.com and the main contributor to the ChartSchool.
| Title: | Editor |
| Company: | TDTrader.com |
| Address: | Willem Geetsstraat 17 |
| Mechelen, B2800 | |
| Phone # for sales: | 3215345465 |
| Website: | www.tdtrader.com |
| E-mail address: | arthurh@tdtrader.com |
Traders' Resource Links | |
| TDTrader.com has not added any product or service information to TRADERS' RESOURCE. | |
Click here for more information about our publications!
PRINT THIS ARTICLE

Request Information From Our Sponsors
- StockCharts.com, Inc.
- Candle Patterns
- Candlestick Charting Explained
- Intermarket Technical Analysis
- John Murphy on Chart Analysis
- John Murphy's Chart Pattern Recognition
- John Murphy's Market Message
- MurphyExplainsMarketAnalysis-Intermarket Analysis
- MurphyExplainsMarketAnalysis-Visual Analysis
- StockCharts.com
- Technical Analysis of the Financial Markets
- The Visual Investor
- VectorVest, Inc.
- Executive Premier Workshop
- One-Day Options Course
- OptionsPro
- Retirement Income Workshop
- Sure-Fire Trading Systems (VectorVest, Inc.)
- Trading as a Business Workshop
- VectorVest 7 EOD
- VectorVest 7 RealTime/IntraDay
- VectorVest AutoTester
- VectorVest Educational Services
- VectorVest OnLine
- VectorVest Options Analyzer
- VectorVest ProGraphics v6.0
- VectorVest ProTrader 7
- VectorVest RealTime Derby Tool
- VectorVest Simulator
- VectorVest Variator
- VectorVest Watchdog
