HOT TOPICS LIST
- MACD
- Fibonacci
- RSI
- Gann
- ADXR
- Stochastics
- Volume
- Triangles
- Futures
- Cycles
- Volatility
- ZIGZAG
- MESA
- Retracement
- Aroon
INDICATORS LIST
LIST OF TOPICS
PRINT THIS ARTICLE
by Arthur Hill
Oversold readings in the Nasdaq TRIN have preceded a number of rallies over the last twelve months. Despite the current decline, the Nasdaq TRIN has yet to become oversold and this suggests more room for downside.
Position: Sell
Arthur Hill
Arthur Hill is currently editor of TDTrader.com, a website specializing in trading strategies, sector/industry specific breadth stats and overall technical analysis. He passed the Society of Technical Analysts (STA London) diploma exam with distinction is a Certified Financial Technician (CFTe). Prior to TD Trader, he was the Chief Technical Analyst for Stockcharts.com and the main contributor to the ChartSchool.
PRINT THIS ARTICLE
TRIN OPEN-10
Nasdaq TRIN Not Oversold Yet
03/19/04 01:41:18 PMby Arthur Hill
Oversold readings in the Nasdaq TRIN have preceded a number of rallies over the last twelve months. Despite the current decline, the Nasdaq TRIN has yet to become oversold and this suggests more room for downside.
Position: Sell
| The TRIN is designed to compare the volume in advancing issues with the volume in declining issues. When volume in advancing issues outpaces volume in declining issues, the TRIN is below 1 and the market is considered strong. When volume in declining issues outpaces volume in advancing issues, the TRIN is above 1 and the market is considered weak. |

|
| Figure 1: Examples of TRIN. |
| Graphic provided by: MetaStock. |
| |
| The TRIN has an inverse relationship with the market. It rises when volume in declining stocks is strong and declines when volume in advancing stocks is strong. Therefore, the TRIN is often displayed with an inverted scale. Because daily fluctuations can be quite volatile, a moving average is often used to smooth the data series. In addition, the TRIN fluctuates from zero to infinity and analysts also employ semi-log scales to balance the fluctuations. Figure 1 above shows the difference between inverted and normal scales as well as semi-log versus arithmetic scales. |
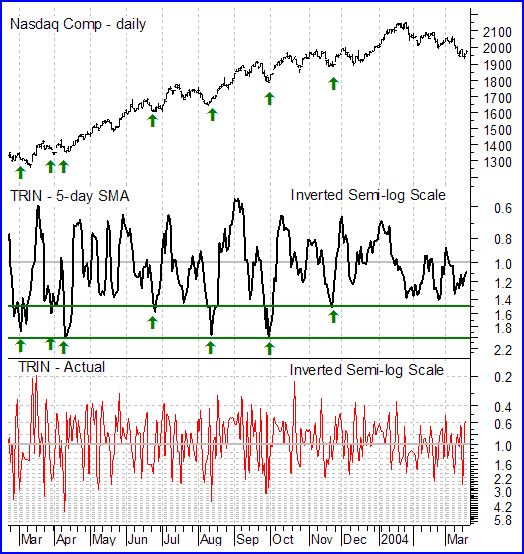
 Figure 2: Daily chart of Nasdaq. There are a number of methods to use the TRIN indicator with overbought and oversold readings quite popular. Figure 2 shows a 5-day simple moving average for the TRIN over the last 12 months. The TRIN became oversold between 1.5 and 2 at least five times over the past year (green arrows). These oversold readings preceded a bounce in the Nasdaq Composite and continuation of the uptrend. Currently, the 5-day SMA for the TRIN has yet to move below 1.5 this year to produce an oversold reading. Until this occurs, there is further room to fall before traders can expect a sizable bounce. |
Arthur Hill is currently editor of TDTrader.com, a website specializing in trading strategies, sector/industry specific breadth stats and overall technical analysis. He passed the Society of Technical Analysts (STA London) diploma exam with distinction is a Certified Financial Technician (CFTe). Prior to TD Trader, he was the Chief Technical Analyst for Stockcharts.com and the main contributor to the ChartSchool.
| Title: | Editor |
| Company: | TDTrader.com |
| Address: | Willem Geetsstraat 17 |
| Mechelen, B2800 | |
| Phone # for sales: | 3215345465 |
| Website: | www.tdtrader.com |
| E-mail address: | arthurh@tdtrader.com |
Traders' Resource Links | |
| TDTrader.com has not added any product or service information to TRADERS' RESOURCE. | |
Click here for more information about our publications!
Comments
Date: 03/22/04Rank: 5Comment:
Date: 03/23/04Rank: 4Comment:
Date: 03/27/04Rank: 5Comment:

Request Information From Our Sponsors
- VectorVest, Inc.
- Executive Premier Workshop
- One-Day Options Course
- OptionsPro
- Retirement Income Workshop
- Sure-Fire Trading Systems (VectorVest, Inc.)
- Trading as a Business Workshop
- VectorVest 7 EOD
- VectorVest 7 RealTime/IntraDay
- VectorVest AutoTester
- VectorVest Educational Services
- VectorVest OnLine
- VectorVest Options Analyzer
- VectorVest ProGraphics v6.0
- VectorVest ProTrader 7
- VectorVest RealTime Derby Tool
- VectorVest Simulator
- VectorVest Variator
- VectorVest Watchdog
- StockCharts.com, Inc.
- Candle Patterns
- Candlestick Charting Explained
- Intermarket Technical Analysis
- John Murphy on Chart Analysis
- John Murphy's Chart Pattern Recognition
- John Murphy's Market Message
- MurphyExplainsMarketAnalysis-Intermarket Analysis
- MurphyExplainsMarketAnalysis-Visual Analysis
- StockCharts.com
- Technical Analysis of the Financial Markets
- The Visual Investor
