HOT TOPICS LIST
- MACD
- Fibonacci
- RSI
- Gann
- ADXR
- Stochastics
- Volume
- Triangles
- Futures
- Cycles
- Volatility
- ZIGZAG
- MESA
- Retracement
- Aroon
INDICATORS LIST
LIST OF TOPICS
PRINT THIS ARTICLE
by Arthur Hill
FTSE 100 works its way high towards key retracements and remains in uptrend.
Position: N/A
Arthur Hill
Arthur Hill is currently editor of TDTrader.com, a website specializing in trading strategies, sector/industry specific breadth stats and overall technical analysis. He passed the Society of Technical Analysts (STA London) diploma exam with distinction is a Certified Financial Technician (CFTe). Prior to TD Trader, he was the Chief Technical Analyst for Stockcharts.com and the main contributor to the ChartSchool.
PRINT THIS ARTICLE
FIBONACCI
FTSE 100 Nears Double Fibo Zone
03/16/04 01:02:38 PMby Arthur Hill
FTSE 100 works its way high towards key retracements and remains in uptrend.
Position: N/A
| Fibonacci retracements are a useful tool to identify potential reversal points or zones. After an extended decline, a security often retraces a portion with a corrective advance. For Fibonacci numbers, the key retracements are 23.6%, 38.2% and 61.8%. Most technical analysis programs also use 50%, which is a favorite among Dow Theorists. The problem is not so much identifying which retracement to use, but rather the prior advance or decline upon which to base the retracement. |

|
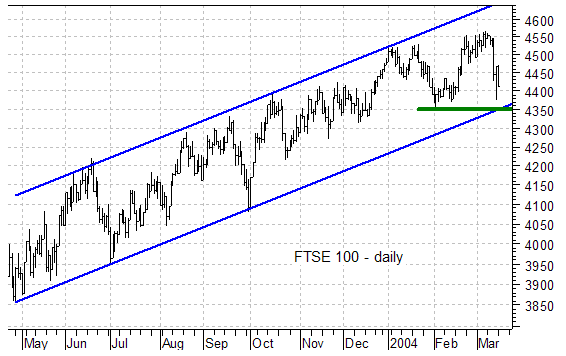
| Figure 1: FTSE 100 daily chart. |
| Graphic provided by: MetaStock. |
| |
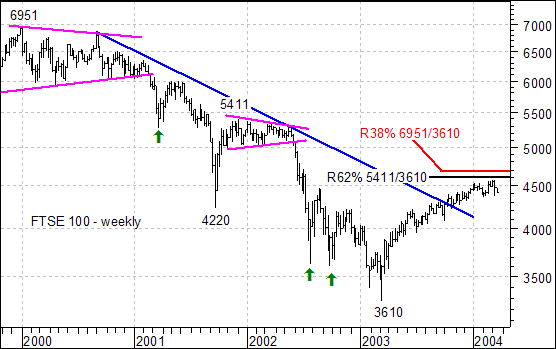
| The FTSE 100 declined from 6951 to 3610 (Jan-00 to Mar-03) and has advanced for a year now. There are two distinct declines: one from 6951 to 4220 and the other from 5411 to 3610. Even though there were some pretty significant reaction rallies (green arrows), they were relatively short in both time and price movement. As such, I choose to ignore them and base the retracements on the two big moves. |
 Figure 2: FTSE 100 weekly chart. Based on the two large declines, the index has advanced into a double Fibonacci zone. First, a 38% retracement of the entire decline (6951 to 3610) would extend to around 4680. Second, a 62% retracement of the second decline (5411 to 3610) would extend to around 4600. These retracements confirm one and other to increase the odds of a reversal or at least resistance in this area. |
| For now, this is simply a potential reversal alert and needs to be confirmed by price action. As the daily chart shows, the index remains within a rising price channel and clear uptrend with higher highs and higher lows. Watch support at 4350, which is substantiated by both the trendline and prior low, for signs of a "confirmed" trend reversal. |
Arthur Hill is currently editor of TDTrader.com, a website specializing in trading strategies, sector/industry specific breadth stats and overall technical analysis. He passed the Society of Technical Analysts (STA London) diploma exam with distinction is a Certified Financial Technician (CFTe). Prior to TD Trader, he was the Chief Technical Analyst for Stockcharts.com and the main contributor to the ChartSchool.
| Title: | Editor |
| Company: | TDTrader.com |
| Address: | Willem Geetsstraat 17 |
| Mechelen, B2800 | |
| Phone # for sales: | 3215345465 |
| Website: | www.tdtrader.com |
| E-mail address: | arthurh@tdtrader.com |
Traders' Resource Links | |
| TDTrader.com has not added any product or service information to TRADERS' RESOURCE. | |
Click here for more information about our publications!
Comments

Request Information From Our Sponsors
- StockCharts.com, Inc.
- Candle Patterns
- Candlestick Charting Explained
- Intermarket Technical Analysis
- John Murphy on Chart Analysis
- John Murphy's Chart Pattern Recognition
- John Murphy's Market Message
- MurphyExplainsMarketAnalysis-Intermarket Analysis
- MurphyExplainsMarketAnalysis-Visual Analysis
- StockCharts.com
- Technical Analysis of the Financial Markets
- The Visual Investor
- VectorVest, Inc.
- Executive Premier Workshop
- One-Day Options Course
- OptionsPro
- Retirement Income Workshop
- Sure-Fire Trading Systems (VectorVest, Inc.)
- Trading as a Business Workshop
- VectorVest 7 EOD
- VectorVest 7 RealTime/IntraDay
- VectorVest AutoTester
- VectorVest Educational Services
- VectorVest OnLine
- VectorVest Options Analyzer
- VectorVest ProGraphics v6.0
- VectorVest ProTrader 7
- VectorVest RealTime Derby Tool
- VectorVest Simulator
- VectorVest Variator
- VectorVest Watchdog
