

HOT TOPICS LIST
- MACD
- Fibonacci
- RSI
- Gann
- ADXR
- Stochastics
- Volume
- Triangles
- Futures
- Cycles
- Volatility
- ZIGZAG
- MESA
- Retracement
- Aroon
INDICATORS LIST
LIST OF TOPICS
PRINT THIS ARTICLE
by Arthur Hill
Barrick Gold (ABX) suffered a sharp decline in January and the current advance looks like a corrective rally.
Position: Sell
Arthur Hill
Arthur Hill is currently editor of TDTrader.com, a website specializing in trading strategies, sector/industry specific breadth stats and overall technical analysis. He passed the Society of Technical Analysts (STA London) diploma exam with distinction is a Certified Financial Technician (CFTe). Prior to TD Trader, he was the Chief Technical Analyst for Stockcharts.com and the main contributor to the ChartSchool.
PRINT THIS ARTICLE
GOLD & METALS
Barrick Gold Stalls At Key Retracement
03/16/04 11:46:30 AMby Arthur Hill
Barrick Gold (ABX) suffered a sharp decline in January and the current advance looks like a corrective rally.
Position: Sell
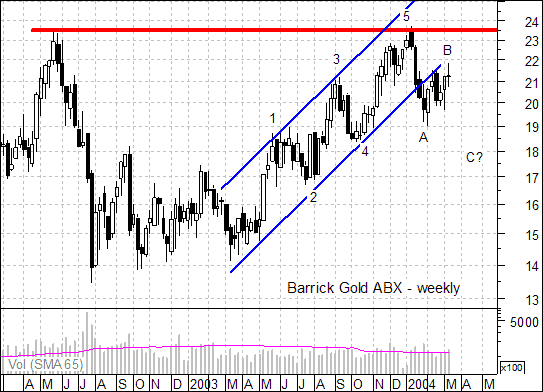 Figure 1: Weekly chart of ABX. As the weekly chart shows, ABX advanced within a nice rising price channel from around 14 to 23.5. Resistance around 23.5 extends back to May 2002 and this level proved itself again in February 2003. The stock broke below the lower trendline with a sharp decline on above average volume and this suggests that at least a correction is in order. |
| The advance was made up of five waves with three up and two down. Normally, Wave 3 is the longest in both duration and price appreciation. However, this Wave 3 was roughly equal to Waves 1 and 5. Because technical analysis is a mixture of "art" and "science," and the Five-Wave structure is quite pronounced, I find it acceptable. After a Five-Wave advance, a correction of sorts can be expected and this usually takes the form of an ABC pattern. Wave A is the first decline, Wave B is the reaction rally and Wave C is the continuation. Wave C is often equal to Wave A and this can be used to project a downside target or even a reversal zone. As such, the projected move is to around 17.12 (23.7 - 19 = 4.7, 21.82 - 4.7 = 17.12). |
|
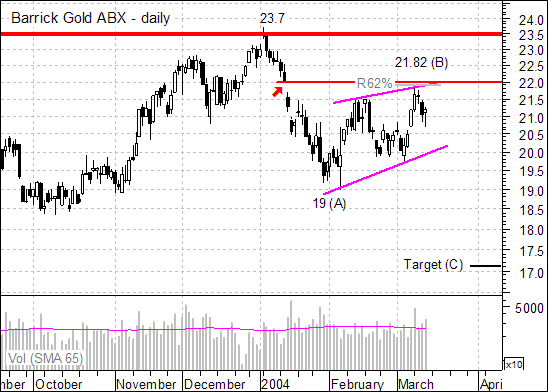
| Figure 2: Daily chart of ABX. |
| Graphic provided by: MetaStock. |
| |
| Turning to the daily chart, we can see a classic 62% retracement and rising wedge. Both are typical for reaction rallies or Wave B advances. Also notice that ABX met resistance from the January 14 gap (red arrow). As long as the lower trendline holds, Wave B is a work in progress. A move below the lower trendline would signal a continuation lower and the start of Wave C. |
Arthur Hill is currently editor of TDTrader.com, a website specializing in trading strategies, sector/industry specific breadth stats and overall technical analysis. He passed the Society of Technical Analysts (STA London) diploma exam with distinction is a Certified Financial Technician (CFTe). Prior to TD Trader, he was the Chief Technical Analyst for Stockcharts.com and the main contributor to the ChartSchool.
| Title: | Editor |
| Company: | TDTrader.com |
| Address: | Willem Geetsstraat 17 |
| Mechelen, B2800 | |
| Phone # for sales: | 3215345465 |
| Website: | www.tdtrader.com |
| E-mail address: | arthurh@tdtrader.com |
Traders' Resource Links | |
| TDTrader.com has not added any product or service information to TRADERS' RESOURCE. | |
Click here for more information about our publications!
PRINT THIS ARTICLE

Request Information From Our Sponsors
- StockCharts.com, Inc.
- Candle Patterns
- Candlestick Charting Explained
- Intermarket Technical Analysis
- John Murphy on Chart Analysis
- John Murphy's Chart Pattern Recognition
- John Murphy's Market Message
- MurphyExplainsMarketAnalysis-Intermarket Analysis
- MurphyExplainsMarketAnalysis-Visual Analysis
- StockCharts.com
- Technical Analysis of the Financial Markets
- The Visual Investor
- VectorVest, Inc.
- Executive Premier Workshop
- One-Day Options Course
- OptionsPro
- Retirement Income Workshop
- Sure-Fire Trading Systems (VectorVest, Inc.)
- Trading as a Business Workshop
- VectorVest 7 EOD
- VectorVest 7 RealTime/IntraDay
- VectorVest AutoTester
- VectorVest Educational Services
- VectorVest OnLine
- VectorVest Options Analyzer
- VectorVest ProGraphics v6.0
- VectorVest ProTrader 7
- VectorVest RealTime Derby Tool
- VectorVest Simulator
- VectorVest Variator
- VectorVest Watchdog