HOT TOPICS LIST
- MACD
- Fibonacci
- RSI
- Gann
- ADXR
- Stochastics
- Volume
- Triangles
- Futures
- Cycles
- Volatility
- ZIGZAG
- MESA
- Retracement
- Aroon
INDICATORS LIST
LIST OF TOPICS
PRINT THIS ARTICLE
by Arthur Hill
The Nikkei 225 was profiled on February 18, with a potential head and shoulders brewing. Now that the index broke above neckline resistance, it is time to consider what it would take to prove the breakout "otherwise."
Position: N/A
Arthur Hill
Arthur Hill is currently editor of TDTrader.com, a website specializing in trading strategies, sector/industry specific breadth stats and overall technical analysis. He passed the Society of Technical Analysts (STA London) diploma exam with distinction is a Certified Financial Technician (CFTe). Prior to TD Trader, he was the Chief Technical Analyst for Stockcharts.com and the main contributor to the ChartSchool.
PRINT THIS ARTICLE
CHART ANALYSIS
OTC Cousin Leads Nikkei 225
03/12/04 11:36:46 AMby Arthur Hill
The Nikkei 225 was profiled on February 18, with a potential head and shoulders brewing. Now that the index broke above neckline resistance, it is time to consider what it would take to prove the breakout "otherwise."
Position: N/A
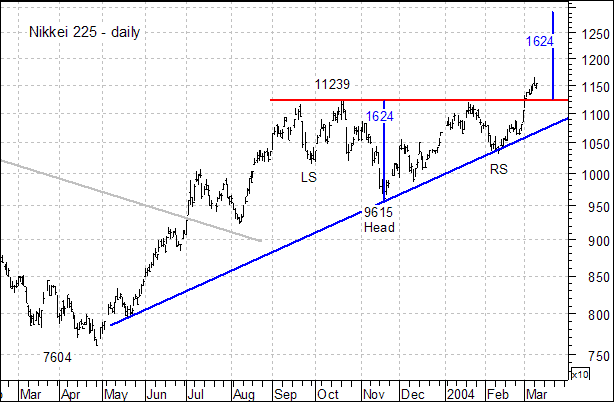
| One of the basic tenets of technical analysis is that broken resistance turns into support. The index established resistance at 11239 with three touches over the last six to seven months. While below neckline support, 11239 was a source of supply or selling pressure that prevented the index from moving higher. Now that demand has overpowered supply, this level becomes a source of demand and will be the first test of bullish resolve. A move back below 11239 would reflect weak demand. |
| The trendline extending up from May 2003 is the next item on the watch list. This trendline has been touched three times, which makes it a valid trendline as opposed to a tentative trendline. The price scale is semi-log (percentage based) and the trendline represents the rate of ascent. As long as this trendline holds, the rate of ascent is consistent and clearly rising. A move below the lower trendline would show weakness and question the uptrend. |

|
| Figure 1: Nikkei 225 daily chart. |
| Graphic provided by: MetaStock. |
| |
| The February low represents the last bastion of bullishness. A failure to hold above 11239, a trendline break and a move below the February low would firmly tilt the balance back to the bears. This would show increased selling pressure and mark a significant turning point. |
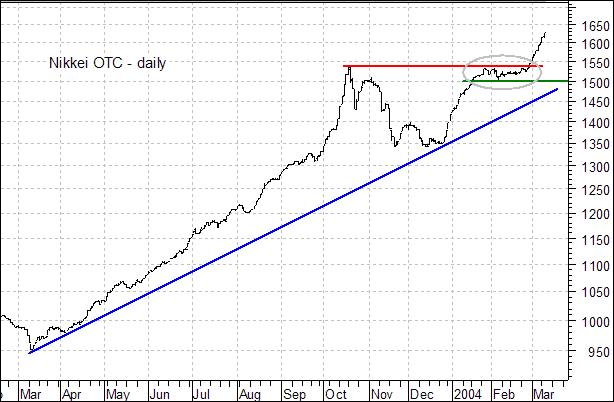
 Figure 2: Nikkei OTC daily chart. In addition to the Nikkei 225, traders should also keep an eye on the Nikkei OTC, which represents the more speculative branch of the Nikkei and recently moved above resistance and to a three and a half year high. In contrast, the Nikkei 225 is only at a 21-month high. The Nikkei OTC formed a consolidation in February and broke resistance a day ahead of the Nikkei 225. As long as the Nikkei OTC holds above consolidation support at 1500 the prospects for both Nikkei indexes remains bullish. |
Arthur Hill is currently editor of TDTrader.com, a website specializing in trading strategies, sector/industry specific breadth stats and overall technical analysis. He passed the Society of Technical Analysts (STA London) diploma exam with distinction is a Certified Financial Technician (CFTe). Prior to TD Trader, he was the Chief Technical Analyst for Stockcharts.com and the main contributor to the ChartSchool.
| Title: | Editor |
| Company: | TDTrader.com |
| Address: | Willem Geetsstraat 17 |
| Mechelen, B2800 | |
| Phone # for sales: | 3215345465 |
| Website: | www.tdtrader.com |
| E-mail address: | arthurh@tdtrader.com |
Traders' Resource Links | |
| TDTrader.com has not added any product or service information to TRADERS' RESOURCE. | |
Click here for more information about our publications!
PRINT THIS ARTICLE

Request Information From Our Sponsors
- StockCharts.com, Inc.
- Candle Patterns
- Candlestick Charting Explained
- Intermarket Technical Analysis
- John Murphy on Chart Analysis
- John Murphy's Chart Pattern Recognition
- John Murphy's Market Message
- MurphyExplainsMarketAnalysis-Intermarket Analysis
- MurphyExplainsMarketAnalysis-Visual Analysis
- StockCharts.com
- Technical Analysis of the Financial Markets
- The Visual Investor
- VectorVest, Inc.
- Executive Premier Workshop
- One-Day Options Course
- OptionsPro
- Retirement Income Workshop
- Sure-Fire Trading Systems (VectorVest, Inc.)
- Trading as a Business Workshop
- VectorVest 7 EOD
- VectorVest 7 RealTime/IntraDay
- VectorVest AutoTester
- VectorVest Educational Services
- VectorVest OnLine
- VectorVest Options Analyzer
- VectorVest ProGraphics v6.0
- VectorVest ProTrader 7
- VectorVest RealTime Derby Tool
- VectorVest Simulator
- VectorVest Variator
- VectorVest Watchdog
