HOT TOPICS LIST
- MACD
- Fibonacci
- RSI
- Gann
- ADXR
- Stochastics
- Volume
- Triangles
- Futures
- Cycles
- Volatility
- ZIGZAG
- MESA
- Retracement
- Aroon
INDICATORS LIST
LIST OF TOPICS
PRINT THIS ARTICLE
by Arthur Hill
When the trend is strong and up, bearish divergences in MACD and other momentum oscillators are often misleading.
Position: N/A
Arthur Hill
Arthur Hill is currently editor of TDTrader.com, a website specializing in trading strategies, sector/industry specific breadth stats and overall technical analysis. He passed the Society of Technical Analysts (STA London) diploma exam with distinction is a Certified Financial Technician (CFTe). Prior to TD Trader, he was the Chief Technical Analyst for Stockcharts.com and the main contributor to the ChartSchool.
PRINT THIS ARTICLE
MOVING AVERAGES
Misleading Divergences In The S&P SmallCap Index
03/05/04 01:32:28 PMby Arthur Hill
When the trend is strong and up, bearish divergences in MACD and other momentum oscillators are often misleading.
Position: N/A
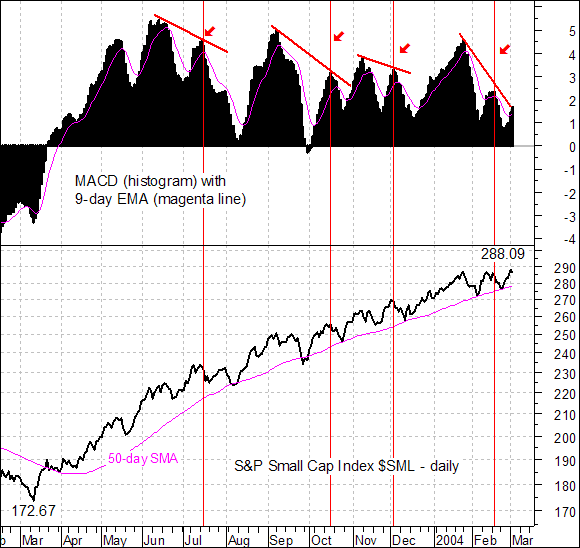
| The S&P SmallCap Index has been in a strong uptrend for almost a year. The index recorded a low on March 12, 2003 at 172.67 and an all time high at 288.09 in early March 2004. The index moved above the 50-day simple moving average in April 2003. During the advance, the index dipped below the 50-day SMA twice, but quickly recovered and forged new highs. As long as this moving average holds, thinking bear would be ignoring the obvious and picking a top. |
| As MACD will testify, momentum oscillators do not work very well in strong trends. The indicator formed no fewer than four bearish divergences over the last 12 months (red arrows) and the index answered with a new reaction high each time. Also notice that MACD has been above zero (in positive territory) since late March. As long as MACD holds above zero, momentum is technically positive or at least still favors the bulls. This fact often gets lost in the desire to pick a top. The lower highs in the bearish divergence show less upside momentum than before, but upside momentum all the same. |

|
| Graphic provided by: MetaStock. |
| |
| The relationship continues. As the chart now stands, MACD has another bearish divergence working while the index is trading near its all time high. As long as the 50-day SMA holds and MACD remains in positive territory, the bulls have a strong tail wind. There will be declines along the way, but these will be against the wind and prone to sudden reversals (i.e. corrections). Until the index breaks the 50-day SMA and MACD moves into negative territory, it would be wise to continue respecting the bulls. |
Arthur Hill is currently editor of TDTrader.com, a website specializing in trading strategies, sector/industry specific breadth stats and overall technical analysis. He passed the Society of Technical Analysts (STA London) diploma exam with distinction is a Certified Financial Technician (CFTe). Prior to TD Trader, he was the Chief Technical Analyst for Stockcharts.com and the main contributor to the ChartSchool.
| Title: | Editor |
| Company: | TDTrader.com |
| Address: | Willem Geetsstraat 17 |
| Mechelen, B2800 | |
| Phone # for sales: | 3215345465 |
| Website: | www.tdtrader.com |
| E-mail address: | arthurh@tdtrader.com |
Traders' Resource Links | |
| TDTrader.com has not added any product or service information to TRADERS' RESOURCE. | |
Click here for more information about our publications!
Comments
Date: 03/05/04Rank: 5Comment:
Date: 03/09/04Rank: 3Comment:
Date: 03/09/04Rank: 4Comment:

|

Request Information From Our Sponsors
- StockCharts.com, Inc.
- Candle Patterns
- Candlestick Charting Explained
- Intermarket Technical Analysis
- John Murphy on Chart Analysis
- John Murphy's Chart Pattern Recognition
- John Murphy's Market Message
- MurphyExplainsMarketAnalysis-Intermarket Analysis
- MurphyExplainsMarketAnalysis-Visual Analysis
- StockCharts.com
- Technical Analysis of the Financial Markets
- The Visual Investor
- VectorVest, Inc.
- Executive Premier Workshop
- One-Day Options Course
- OptionsPro
- Retirement Income Workshop
- Sure-Fire Trading Systems (VectorVest, Inc.)
- Trading as a Business Workshop
- VectorVest 7 EOD
- VectorVest 7 RealTime/IntraDay
- VectorVest AutoTester
- VectorVest Educational Services
- VectorVest OnLine
- VectorVest Options Analyzer
- VectorVest ProGraphics v6.0
- VectorVest ProTrader 7
- VectorVest RealTime Derby Tool
- VectorVest Simulator
- VectorVest Variator
- VectorVest Watchdog
