HOT TOPICS LIST
- MACD
- Fibonacci
- RSI
- Gann
- ADXR
- Stochastics
- Volume
- Triangles
- Futures
- Cycles
- Volatility
- ZIGZAG
- MESA
- Retracement
- Aroon
INDICATORS LIST
LIST OF TOPICS
PRINT THIS ARTICLE
by Arthur Hill
In an ominous sign for the semi-conductor group and Nasdaq, Intel (INTC) broke double top support and the trend has turned bearish.
Position: Sell
Arthur Hill
Arthur Hill is currently editor of TDTrader.com, a website specializing in trading strategies, sector/industry specific breadth stats and overall technical analysis. He passed the Society of Technical Analysts (STA London) diploma exam with distinction is a Certified Financial Technician (CFTe). Prior to TD Trader, he was the Chief Technical Analyst for Stockcharts.com and the main contributor to the ChartSchool.
PRINT THIS ARTICLE
DOUBLE TOPS
Intel Turns Bearish
03/04/04 10:53:15 AMby Arthur Hill
In an ominous sign for the semi-conductor group and Nasdaq, Intel (INTC) broke double top support and the trend has turned bearish.
Position: Sell
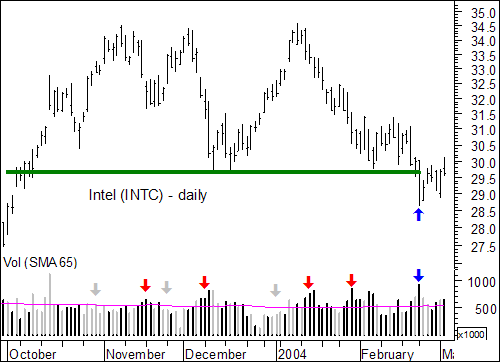
 Figure 1: Daily chart of Intel. The double top took three to four months to form and represents a large distribution. As the pattern unfolded, volume pattern began to favor the bears. Notice that the advances were on relatively low volume (gray arrows) and the declines were on relatively high volume (red arrows). This was a telltale sign that the "smart" money was distributing shares to the "not-so-smart" money. (Note: The gray bars show volume on advancing days and the black bars shows volume on declining days.) |
| As with most bearish reversal patterns, final confirmation does not come until a support break. For INTC, the December reaction low represents the last bastion of bullish support or the final stand for the forces of demand. Up until late February, the bulls managed to stave off pattern completion, but the big break on high volume (blue arrow) is the straw that broke the double top's back. Supply has officially overpowered demand. |

|
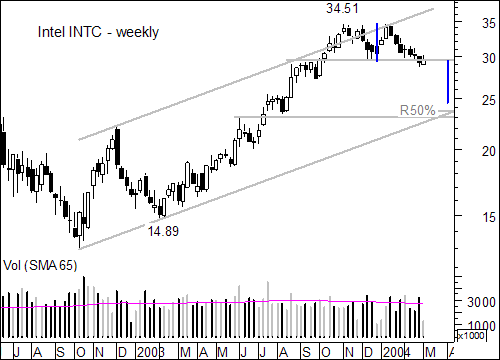
| Figure 2: Weekly chart of Intel. |
| Graphic provided by: MetaStock. |
| |
| With a trend reversal identified, we can now turn to the weekly chart for some perspective and downside targets. The double top projects further weakness to around 24.5 (34.5 - 29.5 = 5, 29.5 - 5 = 24.5). In addition, a 50% retracement of the prior advance (14.89 to 34.51) would extend to around 24. This area is also confirmed by the trendline extending up from the March low and broken resistance (turned support) around 23. Putting it all together, 23-24 is the downside target zone for Intel over the next few weeks and months. |
Arthur Hill is currently editor of TDTrader.com, a website specializing in trading strategies, sector/industry specific breadth stats and overall technical analysis. He passed the Society of Technical Analysts (STA London) diploma exam with distinction is a Certified Financial Technician (CFTe). Prior to TD Trader, he was the Chief Technical Analyst for Stockcharts.com and the main contributor to the ChartSchool.
| Title: | Editor |
| Company: | TDTrader.com |
| Address: | Willem Geetsstraat 17 |
| Mechelen, B2800 | |
| Phone # for sales: | 3215345465 |
| Website: | www.tdtrader.com |
| E-mail address: | arthurh@tdtrader.com |
Traders' Resource Links | |
| TDTrader.com has not added any product or service information to TRADERS' RESOURCE. | |
Click here for more information about our publications!
Comments
Date: 03/09/04Rank: 5Comment:

Request Information From Our Sponsors
- StockCharts.com, Inc.
- Candle Patterns
- Candlestick Charting Explained
- Intermarket Technical Analysis
- John Murphy on Chart Analysis
- John Murphy's Chart Pattern Recognition
- John Murphy's Market Message
- MurphyExplainsMarketAnalysis-Intermarket Analysis
- MurphyExplainsMarketAnalysis-Visual Analysis
- StockCharts.com
- Technical Analysis of the Financial Markets
- The Visual Investor
- VectorVest, Inc.
- Executive Premier Workshop
- One-Day Options Course
- OptionsPro
- Retirement Income Workshop
- Sure-Fire Trading Systems (VectorVest, Inc.)
- Trading as a Business Workshop
- VectorVest 7 EOD
- VectorVest 7 RealTime/IntraDay
- VectorVest AutoTester
- VectorVest Educational Services
- VectorVest OnLine
- VectorVest Options Analyzer
- VectorVest ProGraphics v6.0
- VectorVest ProTrader 7
- VectorVest RealTime Derby Tool
- VectorVest Simulator
- VectorVest Variator
- VectorVest Watchdog
