HOT TOPICS LIST
- MACD
- Fibonacci
- RSI
- Gann
- ADXR
- Stochastics
- Volume
- Triangles
- Futures
- Cycles
- Volatility
- ZIGZAG
- MESA
- Retracement
- Aroon
INDICATORS LIST
LIST OF TOPICS
PRINT THIS ARTICLE
by Arthur Hill
After a big advance in the late 90s, Wal-Mart (WMT) formed a huge consolidation over the last four years. The direction of the break is likely to have long-term implications for the Dow and the rest of the market.
Position: Hold
Arthur Hill
Arthur Hill is currently editor of TDTrader.com, a website specializing in trading strategies, sector/industry specific breadth stats and overall technical analysis. He passed the Society of Technical Analysts (STA London) diploma exam with distinction is a Certified Financial Technician (CFTe). Prior to TD Trader, he was the Chief Technical Analyst for Stockcharts.com and the main contributor to the ChartSchool.
PRINT THIS ARTICLE
SYMMETRICAL TRIANGLE
Wal-Mart Forms Massive Consolidation
02/19/04 10:14:32 AMby Arthur Hill
After a big advance in the late 90s, Wal-Mart (WMT) formed a huge consolidation over the last four years. The direction of the break is likely to have long-term implications for the Dow and the rest of the market.
Position: Hold

|
| Graphic provided by: MetaStock. |
| |
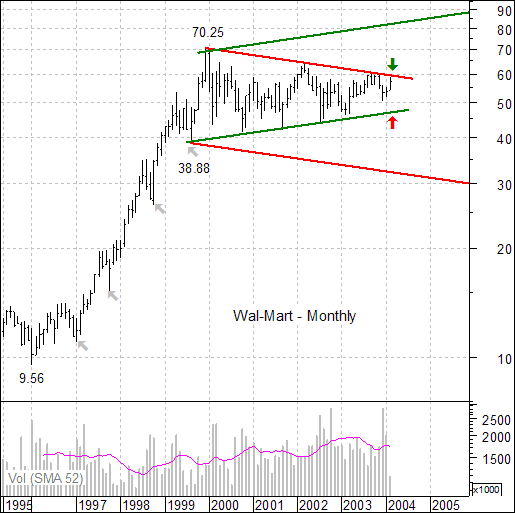
| This monthly chart shows a nine-year perspective on Wal-Mart, a key Dow component. The stock advanced from 9.56 in January 1996 to 70.25 in December 1999. It was a solid four-year run with only a few minor hiccups along the way (gray arrows). In fact, the advance occurred without a significant consolidation or correction. |
| Things began to change in 2000 as the stock finished the year with its first loss since 1995. Trading was pretty much sideways from 2001 to 2003 and a large symmetrical triangle formed. These are neutral patterns dependent on a breakout for the next signal. A move above 60 (green arrow) would break the upper trendline and be bullish, while a move below 47 (red arrow) would break the lower trendline and be bearish. Parallel trendlines were drawn to ascertain upside and downside projections. The green trendline extending up from 70.25 continues to around 90 by the end of 2005 and marks the upside target on a break above 60. The red trendline extending down from 38.88 continues down to around 30 by the end of 2005 and marks the downside target on a break below 47. As the noose (symmetrical triangle) tightens, a breakout becomes inevitable. However, as long as the Wal-Mart remains in the symmetrical triangle, the stock lacks direction and consensus as bulls and bears are deadlocked. A move is required to break the deadlock and reestablish direction. Ideally, an upside breakout would be accompanied by expanding volume to increase validity. |
Arthur Hill is currently editor of TDTrader.com, a website specializing in trading strategies, sector/industry specific breadth stats and overall technical analysis. He passed the Society of Technical Analysts (STA London) diploma exam with distinction is a Certified Financial Technician (CFTe). Prior to TD Trader, he was the Chief Technical Analyst for Stockcharts.com and the main contributor to the ChartSchool.
| Title: | Editor |
| Company: | TDTrader.com |
| Address: | Willem Geetsstraat 17 |
| Mechelen, B2800 | |
| Phone # for sales: | 3215345465 |
| Website: | www.tdtrader.com |
| E-mail address: | arthurh@tdtrader.com |
Traders' Resource Links | |
| TDTrader.com has not added any product or service information to TRADERS' RESOURCE. | |
Click here for more information about our publications!
Comments
Date: 02/19/04Rank: 5Comment:

Request Information From Our Sponsors
- VectorVest, Inc.
- Executive Premier Workshop
- One-Day Options Course
- OptionsPro
- Retirement Income Workshop
- Sure-Fire Trading Systems (VectorVest, Inc.)
- Trading as a Business Workshop
- VectorVest 7 EOD
- VectorVest 7 RealTime/IntraDay
- VectorVest AutoTester
- VectorVest Educational Services
- VectorVest OnLine
- VectorVest Options Analyzer
- VectorVest ProGraphics v6.0
- VectorVest ProTrader 7
- VectorVest RealTime Derby Tool
- VectorVest Simulator
- VectorVest Variator
- VectorVest Watchdog
- StockCharts.com, Inc.
- Candle Patterns
- Candlestick Charting Explained
- Intermarket Technical Analysis
- John Murphy on Chart Analysis
- John Murphy's Chart Pattern Recognition
- John Murphy's Market Message
- MurphyExplainsMarketAnalysis-Intermarket Analysis
- MurphyExplainsMarketAnalysis-Visual Analysis
- StockCharts.com
- Technical Analysis of the Financial Markets
- The Visual Investor
