HOT TOPICS LIST
- MACD
- Fibonacci
- RSI
- Gann
- ADXR
- Stochastics
- Volume
- Triangles
- Futures
- Cycles
- Volatility
- ZIGZAG
- MESA
- Retracement
- Aroon
INDICATORS LIST
LIST OF TOPICS
PRINT THIS ARTICLE
by Arthur Hill
Despite a big move last year, the Nikkei 225 remains in a long-term downtrend and is still underperforming the S&P 500. These indexes are quite similar as the Nikkei 225 represents large-caps in Japan while the S&P 500 represents large-caps in the U.S.
Position: N/A
Arthur Hill
Arthur Hill is currently editor of TDTrader.com, a website specializing in trading strategies, sector/industry specific breadth stats and overall technical analysis. He passed the Society of Technical Analysts (STA London) diploma exam with distinction is a Certified Financial Technician (CFTe). Prior to TD Trader, he was the Chief Technical Analyst for Stockcharts.com and the main contributor to the ChartSchool.
PRINT THIS ARTICLE
CHART ANALYSIS
Nikkei Still Lagging
02/20/04 11:53:07 AMby Arthur Hill
Despite a big move last year, the Nikkei 225 remains in a long-term downtrend and is still underperforming the S&P 500. These indexes are quite similar as the Nikkei 225 represents large-caps in Japan while the S&P 500 represents large-caps in the U.S.
Position: N/A

|
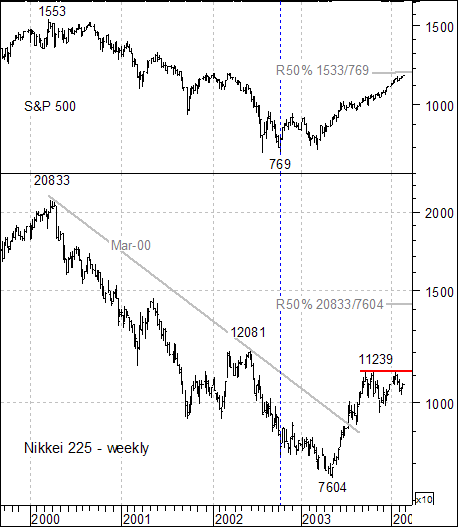
| Figure 1: Weekly chart of the Nikkei 225 and the S&P 500. |
| Graphic provided by: MetaStock. |
| |
| There are three parts to an uptrend: a higher high, higher low and trendline break. As the weekly chart shows, the Nikkei 225 bottomed at 7604 and broke above the Mar-00 trendline. However, the advance stalled around 11250 (red line) and remains below the 2002 high (12081). As far as the long-term trend is concerned, the index formed a lower low at 7604 and has yet to exceed the prior high at 12081. Even though the 2002 advance was extraordinary, it pales in comparison to the prior decline (20883 to 7604) and the long-term trend has yet to fully turn the corner. |
| Relative to the S&P 500, the Nikkei 225 led on the way down and continues to lag on the way up. Since 2000 the S&P 500 declined from 1533 to 769 for a loss of 764 points or 50%. In contrast, the Nikkei 225 declined from 20883 to 7604 for a loss of 13229 points or 63%. Also notice that the S&P 500 bottomed in Oct-02 and again in Mar-03, while the Nikkei 225 continued down until May-03. Even though the recent advance in the Nikkei 225 has been impressive, it has only retraced 27% of its prior decline (20833 to 7604). In contrast, the S&P 500 has retraced 50% of its corresponding decline (1553 to 769). The Nikkei would have to move above 14000 to match the S&P 500 on its retracement. |
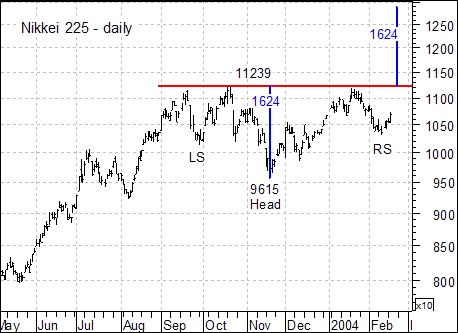
 Figure 2: A possible inverse head and shoulders formation on the Nikkei 225. Although still in the potential phase, the Nikkei 225 could be forming an inverse head and shoulders on the daily bar chart (medium-term trend). The equal highs established neckline resistance at 11239. The left shoulder formed with the late September low and the head with the November low. The right shoulder is still incomplete and it would take a move above 11239 on good volume for confirmation. If confirmed, the upside projection would be to around 12890. As long as it remains unconfirmed, the medium-term trend is neutral at best. |
Arthur Hill is currently editor of TDTrader.com, a website specializing in trading strategies, sector/industry specific breadth stats and overall technical analysis. He passed the Society of Technical Analysts (STA London) diploma exam with distinction is a Certified Financial Technician (CFTe). Prior to TD Trader, he was the Chief Technical Analyst for Stockcharts.com and the main contributor to the ChartSchool.
| Title: | Editor |
| Company: | TDTrader.com |
| Address: | Willem Geetsstraat 17 |
| Mechelen, B2800 | |
| Phone # for sales: | 3215345465 |
| Website: | www.tdtrader.com |
| E-mail address: | arthurh@tdtrader.com |
Traders' Resource Links | |
| TDTrader.com has not added any product or service information to TRADERS' RESOURCE. | |
Click here for more information about our publications!
Comments
Date: 02/23/04Rank: 5Comment:
Date: 02/24/04Rank: 4Comment:

Request Information From Our Sponsors
- StockCharts.com, Inc.
- Candle Patterns
- Candlestick Charting Explained
- Intermarket Technical Analysis
- John Murphy on Chart Analysis
- John Murphy's Chart Pattern Recognition
- John Murphy's Market Message
- MurphyExplainsMarketAnalysis-Intermarket Analysis
- MurphyExplainsMarketAnalysis-Visual Analysis
- StockCharts.com
- Technical Analysis of the Financial Markets
- The Visual Investor
- VectorVest, Inc.
- Executive Premier Workshop
- One-Day Options Course
- OptionsPro
- Retirement Income Workshop
- Sure-Fire Trading Systems (VectorVest, Inc.)
- Trading as a Business Workshop
- VectorVest 7 EOD
- VectorVest 7 RealTime/IntraDay
- VectorVest AutoTester
- VectorVest Educational Services
- VectorVest OnLine
- VectorVest Options Analyzer
- VectorVest ProGraphics v6.0
- VectorVest ProTrader 7
- VectorVest RealTime Derby Tool
- VectorVest Simulator
- VectorVest Variator
- VectorVest Watchdog
