HOT TOPICS LIST
- MACD
- Fibonacci
- RSI
- Gann
- ADXR
- Stochastics
- Volume
- Triangles
- Futures
- Cycles
- Volatility
- ZIGZAG
- MESA
- Retracement
- Aroon
INDICATORS LIST
LIST OF TOPICS
PRINT THIS ARTICLE
by Arthur Hill
Best Buy (BBY), an important retailer and cyclical stock, led the market higher in 2003, but the early signals in 2004 point to weakness that could extend into the industry and sector.
Position: Sell
Arthur Hill
Arthur Hill is currently editor of TDTrader.com, a website specializing in trading strategies, sector/industry specific breadth stats and overall technical analysis. He passed the Society of Technical Analysts (STA London) diploma exam with distinction is a Certified Financial Technician (CFTe). Prior to TD Trader, he was the Chief Technical Analyst for Stockcharts.com and the main contributor to the ChartSchool.
PRINT THIS ARTICLE
FLAGS AND PENNANTS
Best Buy Leading Retail Lower
02/06/04 11:56:42 AMby Arthur Hill
Best Buy (BBY), an important retailer and cyclical stock, led the market higher in 2003, but the early signals in 2004 point to weakness that could extend into the industry and sector.
Position: Sell
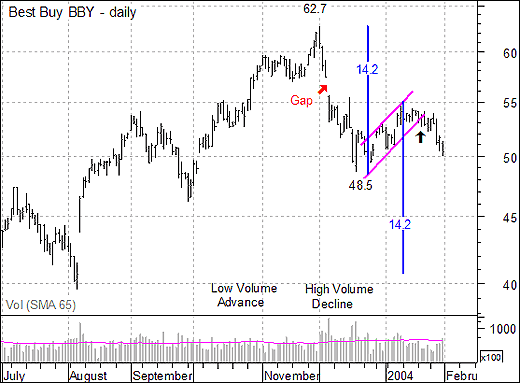
| Best Buy started showing signs of weakness in late December and early January. The S&P 500 advanced above 1100 at the end of December to a 19 month high. BBY managed to bounce in late December, but came nowhere close to its prior high at 62.7 and severely underperformed the S&P 500. SPX continued its advance in January and BBY could only muster a rising flag and a 38-50% retracement of the prior decline to extend its underperformance. |

|
| Figure 1: Daily chart of BBY. |
| Graphic provided by: MetaStock. |
| |
| With the rising flag trendline break (black arrow), BBY signaled a continuation lower and looks set to further underperform the S&P 500. Also notice that volume during the October/November advance was low and then expanded with the December decline. This volume expansion shows new selling pressure and suggests more than just a mere correction. In addition, the rising flag and retracement amount (38-50%) are typical of countertrend rallies. |
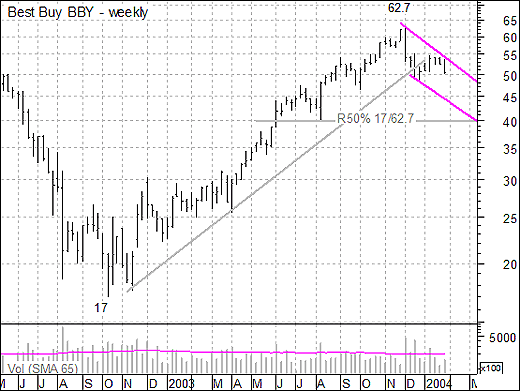
 Figure 2: Weekly chart of BBY. Now that lower prices are expected, it makes sense to look at some downside targets. Flags are said to fly at half-mast and the prior decline was 14.2 points. A similar move from the top of the flag would project further weakness to around 40.8. Looking at the weekly chart, a classic 50% retracement of the prior advance (17 to 62.7) would extend to around 40. Also, the lower trendline of a potential descending price channel extends to around 40. The upper trendline was drawn first and the lower trendline was drawn parallel for a downside target. |
| No matter how you slice it, all roads lead to 40 over the next few week and months. It would take a move above 55 to negate this bearish prognosis. |
Arthur Hill is currently editor of TDTrader.com, a website specializing in trading strategies, sector/industry specific breadth stats and overall technical analysis. He passed the Society of Technical Analysts (STA London) diploma exam with distinction is a Certified Financial Technician (CFTe). Prior to TD Trader, he was the Chief Technical Analyst for Stockcharts.com and the main contributor to the ChartSchool.
| Title: | Editor |
| Company: | TDTrader.com |
| Address: | Willem Geetsstraat 17 |
| Mechelen, B2800 | |
| Phone # for sales: | 3215345465 |
| Website: | www.tdtrader.com |
| E-mail address: | arthurh@tdtrader.com |
Traders' Resource Links | |
| TDTrader.com has not added any product or service information to TRADERS' RESOURCE. | |
Click here for more information about our publications!
PRINT THIS ARTICLE

Request Information From Our Sponsors
- StockCharts.com, Inc.
- Candle Patterns
- Candlestick Charting Explained
- Intermarket Technical Analysis
- John Murphy on Chart Analysis
- John Murphy's Chart Pattern Recognition
- John Murphy's Market Message
- MurphyExplainsMarketAnalysis-Intermarket Analysis
- MurphyExplainsMarketAnalysis-Visual Analysis
- StockCharts.com
- Technical Analysis of the Financial Markets
- The Visual Investor
- VectorVest, Inc.
- Executive Premier Workshop
- One-Day Options Course
- OptionsPro
- Retirement Income Workshop
- Sure-Fire Trading Systems (VectorVest, Inc.)
- Trading as a Business Workshop
- VectorVest 7 EOD
- VectorVest 7 RealTime/IntraDay
- VectorVest AutoTester
- VectorVest Educational Services
- VectorVest OnLine
- VectorVest Options Analyzer
- VectorVest ProGraphics v6.0
- VectorVest ProTrader 7
- VectorVest RealTime Derby Tool
- VectorVest Simulator
- VectorVest Variator
- VectorVest Watchdog
