HOT TOPICS LIST
- MACD
- Fibonacci
- RSI
- Gann
- ADXR
- Stochastics
- Volume
- Triangles
- Futures
- Cycles
- Volatility
- ZIGZAG
- MESA
- Retracement
- Aroon
INDICATORS LIST
LIST OF TOPICS
PRINT THIS ARTICLE
by Arthur Hill
The Dow suffered its largest two-day decline since 26-Sept and a key momentum oscillator flashed a sell signal. Even though the near-term outlook is cloudy, any decline from current levels would still be deemed a correction within a larger uptrend.
Position: Sell
Arthur Hill
Arthur Hill is currently editor of TDTrader.com, a website specializing in trading strategies, sector/industry specific breadth stats and overall technical analysis. He passed the Society of Technical Analysts (STA London) diploma exam with distinction is a Certified Financial Technician (CFTe). Prior to TD Trader, he was the Chief Technical Analyst for Stockcharts.com and the main contributor to the ChartSchool.
PRINT THIS ARTICLE
CHART ANALYSIS
Bearish Failure Swing For The Dow
02/02/04 11:02:08 AMby Arthur Hill
The Dow suffered its largest two-day decline since 26-Sept and a key momentum oscillator flashed a sell signal. Even though the near-term outlook is cloudy, any decline from current levels would still be deemed a correction within a larger uptrend.
Position: Sell
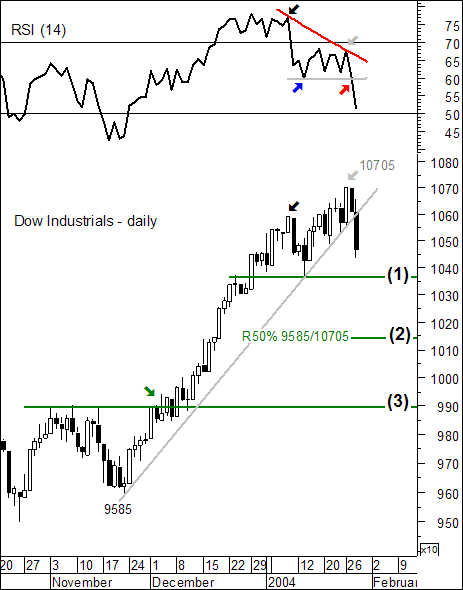
| The last significant signal for the Dow was the early December breakout at 990 (green arrow). This set the stage for the sharpest advance since May-03 (1120 points or 10.46% in 1 1/2 months). The advance was pretty much straight up without a correction or significant consolidation. |

|
| Graphic provided by: MetaStock. |
| |
| With the recent decline from 10705, the Dow broke the trendline extending up from 9585 and RSI forged a rare bearish failure swing. This bearish failure swing occurs in four stages. First, the RSI moves above 70 and the underlying security records a new reaction high (black arrows). Second, the RSI declines below 70 (blue arrow). Third, the RSI forms a reaction high below 70 while the underlying security moves to a new reaction high (gray arrows). This also forms a classic bearish divergence between the indicator and the security. Fourth, RSI moves below its prior reaction low (red arrow) for final confirmation. |
| A correction would be expected to retrace a portion of the prior advance (9585 to 10705) and there are three downside targets to watch. First, the January low marks support around 10367 (1). Second, a 50% retracement of the prior advance would extend to around 10150 (2). Third, a deep correction could extend all the way back to broken resistance (turned support) around 990. This would be a bit excessive though and the second target at 10150 is more realistic over the next few weeks. |
Arthur Hill is currently editor of TDTrader.com, a website specializing in trading strategies, sector/industry specific breadth stats and overall technical analysis. He passed the Society of Technical Analysts (STA London) diploma exam with distinction is a Certified Financial Technician (CFTe). Prior to TD Trader, he was the Chief Technical Analyst for Stockcharts.com and the main contributor to the ChartSchool.
| Title: | Editor |
| Company: | TDTrader.com |
| Address: | Willem Geetsstraat 17 |
| Mechelen, B2800 | |
| Phone # for sales: | 3215345465 |
| Website: | www.tdtrader.com |
| E-mail address: | arthurh@tdtrader.com |
Traders' Resource Links | |
| TDTrader.com has not added any product or service information to TRADERS' RESOURCE. | |
Click here for more information about our publications!
Comments

Request Information From Our Sponsors
- StockCharts.com, Inc.
- Candle Patterns
- Candlestick Charting Explained
- Intermarket Technical Analysis
- John Murphy on Chart Analysis
- John Murphy's Chart Pattern Recognition
- John Murphy's Market Message
- MurphyExplainsMarketAnalysis-Intermarket Analysis
- MurphyExplainsMarketAnalysis-Visual Analysis
- StockCharts.com
- Technical Analysis of the Financial Markets
- The Visual Investor
- VectorVest, Inc.
- Executive Premier Workshop
- One-Day Options Course
- OptionsPro
- Retirement Income Workshop
- Sure-Fire Trading Systems (VectorVest, Inc.)
- Trading as a Business Workshop
- VectorVest 7 EOD
- VectorVest 7 RealTime/IntraDay
- VectorVest AutoTester
- VectorVest Educational Services
- VectorVest OnLine
- VectorVest Options Analyzer
- VectorVest ProGraphics v6.0
- VectorVest ProTrader 7
- VectorVest RealTime Derby Tool
- VectorVest Simulator
- VectorVest Variator
- VectorVest Watchdog
