HOT TOPICS LIST
- MACD
- Fibonacci
- RSI
- Gann
- ADXR
- Stochastics
- Volume
- Triangles
- Futures
- Cycles
- Volatility
- ZIGZAG
- MESA
- Retracement
- Aroon
INDICATORS LIST
LIST OF TOPICS
PRINT THIS ARTICLE
by Arthur Hill
Novellus (NVLS), an integral part of the semiconductor group, has doubled since its Oct-02 lows, but has actually underperformed the Nasdaq since Nov-02. A little underperformance is negligible, however, this underperformance is becoming chronic and could come back to haunt the stock.
Position: Hold
Arthur Hill
Arthur Hill is currently editor of TDTrader.com, a website specializing in trading strategies, sector/industry specific breadth stats and overall technical analysis. He passed the Society of Technical Analysts (STA London) diploma exam with distinction is a Certified Financial Technician (CFTe). Prior to TD Trader, he was the Chief Technical Analyst for Stockcharts.com and the main contributor to the ChartSchool.
PRINT THIS ARTICLE
CHART ANALYSIS
Novellus Underperforms Nasdaq
01/26/04 10:13:02 AMby Arthur Hill
Novellus (NVLS), an integral part of the semiconductor group, has doubled since its Oct-02 lows, but has actually underperformed the Nasdaq since Nov-02. A little underperformance is negligible, however, this underperformance is becoming chronic and could come back to haunt the stock.
Position: Hold
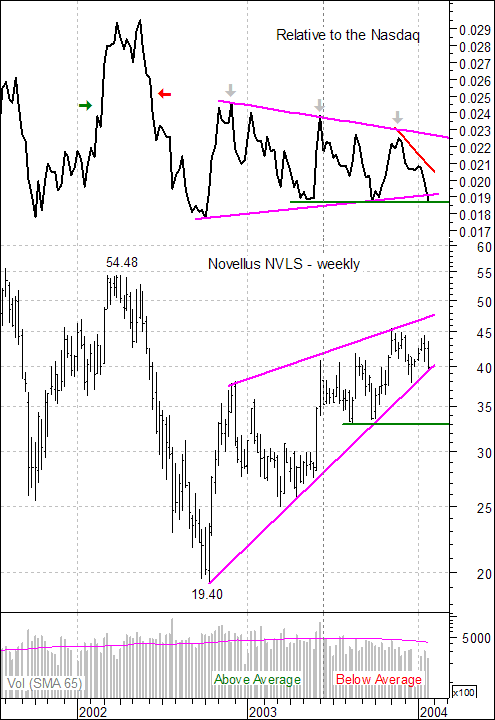
| The price relative compares the performance of NVLS to that of the Nasdaq by plotting a ratio of the two. Based on the January 23 close, the ratio stood at 1.87 (NVLS/Nasdaq or 39.89/2124 = 1.87). NVLS outperforms when the price relative advances (ratio expands) and underperforms when the price relative declines (ratio contracts). |
| NVLS led the Nasdaq higher from Oct-01 to Mar-02 (green arrow) and lower from Mar-02 to Sep-02 (red arrow). Even though the stock has advanced from below 20 to above 40 with a series of higher highs, the price relative formed a series of lower highs (gray arrows). Most recently, the price relative broke below the lower (magenta) trendline and further weakness below the May and September reaction lows would be most ominous. Semiconductors are an important group in the Nasdaq and relative weakness in a key component does not bode well for either. |

|
| Graphic provided by: MetaStock. |
| |
| Looking at the actual price chart, NVLS formed a large rising wedge (magenta trendlines). Volume was above average until mid-June, but below average from mid-June to January as buying interest tailed off. As long as the lower trendline holds, the wedge is still rising and the trend is technically up. Notice that the lower trendline has been touched at least three times, which makes it valid. A move below the lower trendline (approximately 39) would be negative and further weakness below the August/September lows (33) would be most bearish. This would signal a continuation of the prior decline (54.48 to 19.40) and project further weakness below the Oct-02 low. |
Arthur Hill is currently editor of TDTrader.com, a website specializing in trading strategies, sector/industry specific breadth stats and overall technical analysis. He passed the Society of Technical Analysts (STA London) diploma exam with distinction is a Certified Financial Technician (CFTe). Prior to TD Trader, he was the Chief Technical Analyst for Stockcharts.com and the main contributor to the ChartSchool.
| Title: | Editor |
| Company: | TDTrader.com |
| Address: | Willem Geetsstraat 17 |
| Mechelen, B2800 | |
| Phone # for sales: | 3215345465 |
| Website: | www.tdtrader.com |
| E-mail address: | arthurh@tdtrader.com |
Traders' Resource Links | |
| TDTrader.com has not added any product or service information to TRADERS' RESOURCE. | |
Click here for more information about our publications!
Comments
Date: 02/04/04Rank: 3Comment:

|

Request Information From Our Sponsors
- StockCharts.com, Inc.
- Candle Patterns
- Candlestick Charting Explained
- Intermarket Technical Analysis
- John Murphy on Chart Analysis
- John Murphy's Chart Pattern Recognition
- John Murphy's Market Message
- MurphyExplainsMarketAnalysis-Intermarket Analysis
- MurphyExplainsMarketAnalysis-Visual Analysis
- StockCharts.com
- Technical Analysis of the Financial Markets
- The Visual Investor
- VectorVest, Inc.
- Executive Premier Workshop
- One-Day Options Course
- OptionsPro
- Retirement Income Workshop
- Sure-Fire Trading Systems (VectorVest, Inc.)
- Trading as a Business Workshop
- VectorVest 7 EOD
- VectorVest 7 RealTime/IntraDay
- VectorVest AutoTester
- VectorVest Educational Services
- VectorVest OnLine
- VectorVest Options Analyzer
- VectorVest ProGraphics v6.0
- VectorVest ProTrader 7
- VectorVest RealTime Derby Tool
- VectorVest Simulator
- VectorVest Variator
- VectorVest Watchdog
