HOT TOPICS LIST
- MACD
- Fibonacci
- RSI
- Gann
- ADXR
- Stochastics
- Volume
- Triangles
- Futures
- Cycles
- Volatility
- ZIGZAG
- MESA
- Retracement
- Aroon
INDICATORS LIST
LIST OF TOPICS
PRINT THIS ARTICLE
by Matt Blackman
As non-priced based indicators go, the Commitment of Traders' positions are as good as some, better than most. The indicator gave a buy signal on the S&P 500 in early October that was confirmed to still be in force by this week's data.
Position: N/A
Matt Blackman
Matt Blackman is a full-time technical and financial writer and trader. He produces corporate and financial newsletters, and assists clients in getting published in the mainstream media. He is the host of TradeSystemGuru.com. Matt has earned the Chartered Market Technician (CMT) designation. Find out what stocks and futures Matt is watching on Twitter at www.twitter.com/RatioTrade
PRINT THIS ARTICLE
FUTURES
COT Indicator Says Market Still A Buy
01/05/04 10:40:13 AMby Matt Blackman
As non-priced based indicators go, the Commitment of Traders' positions are as good as some, better than most. The indicator gave a buy signal on the S&P 500 in early October that was confirmed to still be in force by this week's data.
Position: N/A
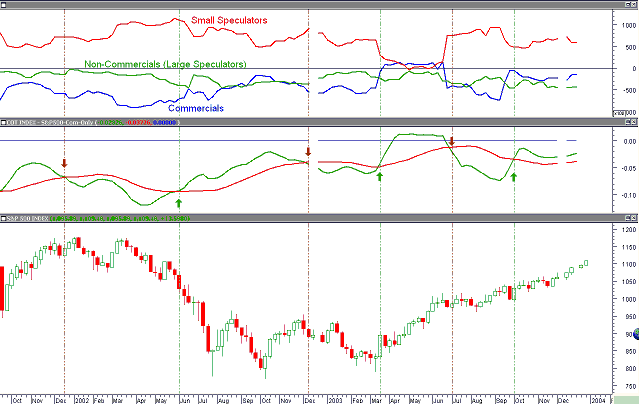
| Published by the Commodity Futures Trading Commission, Commitment of Traders data reports on the positions held by three groups of futures traders every week: commercials, non-commercial large, and small speculators. It is generally accepted that of all the groups, the commercials are most often on the right side of the trade and hence the best to follow. For a more detailed discussion of COT data, please read Clue Hunting Through Commitment of Traders' Data. Backtesting over a four-year period from 1999 through 2003 demonstrated this to be the case with the Standard & Poor's 500 Index futures. An indicator that used 5- and 22-week moving averages of the commercials' positions proved to be an excellent indicator to follow and would have returned the trader following it independently 804 points on a single contract ($1,800). The system bought when the 5-week line crossed above the 22-week line and sold when it crossed below. At $50 per point, that is a return of over $40,000 before commissions. On the negative side the system suffered some pretty severe drawdowns so is not recommended for use as a solitary indicator. But the point of the exercise was to prove that COT commercial positions provided a good signal when trading the S&P 500. |
| As the year ended, the latest buy signal issued in October remained valid, meaning that commercial traders at least continue to expect the S&P 500 to move higher. They may have moved early in the past, but commercials are as good a lead to follow as any when looking at overall market direction as demonstrated by the S&P 500. |

|
| Figure 1: Weekly chart of the S&P 500 with COT positions in the top window, and the COT index composed of the 5- (green) and 22-week (red) moving averages of commercial positions. Dark red and green arrows show sell and buy signals, which proved to be quite accurate with the exception of the early buy signal in June 02 that would have been somewhat painful. It proves that no matter how good an indicator may seem, it is always best to get confirmation in the form of a trendline break or other reliable signal. COT data provided by Maridome.com. |
| Graphic provided by: MetaStock. |
| |
Matt Blackman is a full-time technical and financial writer and trader. He produces corporate and financial newsletters, and assists clients in getting published in the mainstream media. He is the host of TradeSystemGuru.com. Matt has earned the Chartered Market Technician (CMT) designation. Find out what stocks and futures Matt is watching on Twitter at www.twitter.com/RatioTrade
| Company: | TradeSystemGuru.com |
| Address: | Box 2589 |
| Garibaldi Highlands, BC Canada | |
| Phone # for sales: | 604-898-9069 |
| Fax: | 604-898-9069 |
| Website: | www.tradesystemguru.com |
| E-mail address: | indextradermb@gmail.com |
Traders' Resource Links | |
| TradeSystemGuru.com has not added any product or service information to TRADERS' RESOURCE. | |
Click here for more information about our publications!
Comments
Date: 01/06/04Rank: 4Comment:
Date: 01/10/04Rank: 5Comment:

Request Information From Our Sponsors
- StockCharts.com, Inc.
- Candle Patterns
- Candlestick Charting Explained
- Intermarket Technical Analysis
- John Murphy on Chart Analysis
- John Murphy's Chart Pattern Recognition
- John Murphy's Market Message
- MurphyExplainsMarketAnalysis-Intermarket Analysis
- MurphyExplainsMarketAnalysis-Visual Analysis
- StockCharts.com
- Technical Analysis of the Financial Markets
- The Visual Investor
- VectorVest, Inc.
- Executive Premier Workshop
- One-Day Options Course
- OptionsPro
- Retirement Income Workshop
- Sure-Fire Trading Systems (VectorVest, Inc.)
- Trading as a Business Workshop
- VectorVest 7 EOD
- VectorVest 7 RealTime/IntraDay
- VectorVest AutoTester
- VectorVest Educational Services
- VectorVest OnLine
- VectorVest Options Analyzer
- VectorVest ProGraphics v6.0
- VectorVest ProTrader 7
- VectorVest RealTime Derby Tool
- VectorVest Simulator
- VectorVest Variator
- VectorVest Watchdog
