HOT TOPICS LIST
- MACD
- Fibonacci
- RSI
- Gann
- ADXR
- Stochastics
- Volume
- Triangles
- Futures
- Cycles
- Volatility
- ZIGZAG
- MESA
- Retracement
- Aroon
INDICATORS LIST
LIST OF TOPICS
PRINT THIS ARTICLE
by Matt Blackman
Like any indicator, Commitment of Traders (COT) data has its followers. For those who know how to read between the lines, there is always an interesting story to be had.
Position: N/A
Matt Blackman
Matt Blackman is a full-time technical and financial writer and trader. He produces corporate and financial newsletters, and assists clients in getting published in the mainstream media. He is the host of TradeSystemGuru.com. Matt has earned the Chartered Market Technician (CMT) designation. Find out what stocks and futures Matt is watching on Twitter at www.twitter.com/RatioTrade
PRINT THIS ARTICLE
DATA
Clue Hunting Through Commitment Of Traders' Data
08/28/03 08:06:09 AMby Matt Blackman
Like any indicator, Commitment of Traders (COT) data has its followers. For those who know how to read between the lines, there is always an interesting story to be had.
Position: N/A
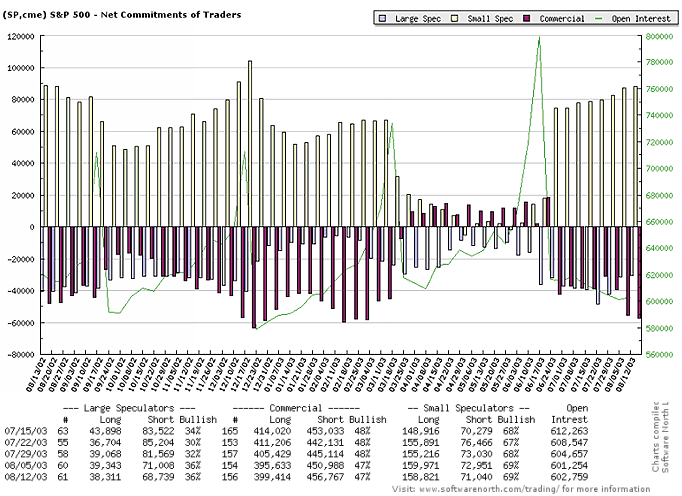
| There is only so much that traditional indicators can tell you, no matter how you construct the data. The stochastic, relative strength index, commodity channel index or myriad of others use various derivations of high, low, open and close but no matter which way you slice it, they are based on the same four pieces of data. Getting confirmation from different indicators using the same information provides comfort only to those who do not understand how they work. Commitment of Traders (COT) contains completely different data sets. Published by the Commodity Futures Trading Commission (CFTC), the data report positions (open interest) every week held by different groups, from the small trader (small speculators) playing with an account worth a few thousand dollars, to the large commercial hedger (commercials) and speculator (non-commercials or large speculators) with accounts of hundreds of millions. (For a detailed discussion of COT data and analysis please refer to the two articles by Jon Andersen in the Suggested Reading section at the end of this article.) |

|
| Figure 1 – Chart showing weekly Commitment of Traders data (COT) from August 13, 2002 to August 12, 2003. Chart from www.softwarenorth.com/trading |
| Graphic provided by: softwarenorth. |
| |
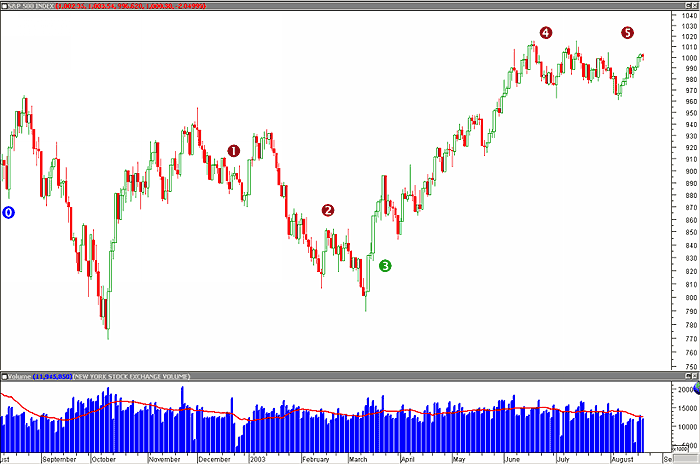
 Figure 2: Daily Standard & Poor's 500 index (SPX) with NYSE total volume showing points where COT Commercials significantly changed their positions. Red numbers represent increases in short positions, green in long positions. The blue zero represents start of COT data in Figure 1. Chart provided by MetaStock.com . History has shown that commercial traders who are "engaged in business activities hedged by the use of futures or options markets" such as those in the mining, farming, processing or marketing of the underlying commodities, tend to be on the right side of the market. By hedging, these entities in effect insure against a future drop in prices. For example, when prices are high, gold producer Barrick Gold might buy a number of put options or sell futures contracts in case the value of gold drops, thus locking in profit at the higher price. (For a discussion of COT and gold, see "Playing the Gold Game.") Small speculators on the other hand are generally wrong and tend to be a good contrarian indicator. However, as Andersen so aptly points out in "Analyze Net Positions," commercials buy and sell for a variety of reasons not simply restricted to anticipating a move. Other than taking out what amounts to an insurance policy on a commodity at a particular price or locking in profit, motives include putting up collateral for a business acquisition or other expense, taking advantage of established cyclical or seasonal movements, or the myriad of other reasons why companies engage in arbitrage transactions. For this reason it is important to understand how they work before blindly buying or selling when they do. I decided to examine how well a trader would have done by following the example set by commercials in the last year. The green numbers in Figure 2 mark points where the commercials were buying, and the brown numbers, where they increased short positions. You can see that this would have been a profitable approach for trading the S&P 500 e-mini or Spiders (SPY). It is also interesting to note that commercials recently increased short positions again. Do they believe prices have topped out for the time being or are there another reasons for the move? Like any indicator, COT data is one tool and it should not be solely relied upon to make buying or selling decisions. Since we are currently locked in a trading range where oscillators work best, a large increase in short positions confirmed by an overbought signal in an oscillator such as the stochastic or relative strength index could provide a good short-term sell signal. |
| Suggested Reading: Andersen, Jon D. [2002], "The Commitment of Traders Report," Stocks & Commodities V.20:4 (April) Andersen, Jon D. [2002], "Analyze Net Positions," Stocks & Commodities V. 20:7 (July) Blackman, Matt [2003], "Most of What You Need to Know About Technical Analysis," Working Money, February 4 Blackman, Matt [2003], "Playing the Gold Game," Working Money, March 11 Blackman, Matt [2003]," In Search of the Trendilator," Working Money, July 8 Commitment of Traders Data from the CFTC http://www.cftc.com/cftc/cftchome.htm |
Matt Blackman is a full-time technical and financial writer and trader. He produces corporate and financial newsletters, and assists clients in getting published in the mainstream media. He is the host of TradeSystemGuru.com. Matt has earned the Chartered Market Technician (CMT) designation. Find out what stocks and futures Matt is watching on Twitter at www.twitter.com/RatioTrade
| Company: | TradeSystemGuru.com |
| Address: | Box 2589 |
| Garibaldi Highlands, BC Canada | |
| Phone # for sales: | 604-898-9069 |
| Fax: | 604-898-9069 |
| Website: | www.tradesystemguru.com |
| E-mail address: | indextradermb@gmail.com |
Traders' Resource Links | |
| TradeSystemGuru.com has not added any product or service information to TRADERS' RESOURCE. | |
Click here for more information about our publications!
Comments
Date: 09/02/03Rank: 4Comment:
Date: 09/04/03Rank: 5Comment:
Date: 01/06/04Rank: 5Comment:

Request Information From Our Sponsors
- StockCharts.com, Inc.
- Candle Patterns
- Candlestick Charting Explained
- Intermarket Technical Analysis
- John Murphy on Chart Analysis
- John Murphy's Chart Pattern Recognition
- John Murphy's Market Message
- MurphyExplainsMarketAnalysis-Intermarket Analysis
- MurphyExplainsMarketAnalysis-Visual Analysis
- StockCharts.com
- Technical Analysis of the Financial Markets
- The Visual Investor
- VectorVest, Inc.
- Executive Premier Workshop
- One-Day Options Course
- OptionsPro
- Retirement Income Workshop
- Sure-Fire Trading Systems (VectorVest, Inc.)
- Trading as a Business Workshop
- VectorVest 7 EOD
- VectorVest 7 RealTime/IntraDay
- VectorVest AutoTester
- VectorVest Educational Services
- VectorVest OnLine
- VectorVest Options Analyzer
- VectorVest ProGraphics v6.0
- VectorVest ProTrader 7
- VectorVest RealTime Derby Tool
- VectorVest Simulator
- VectorVest Variator
- VectorVest Watchdog
