HOT TOPICS LIST
- MACD
- Fibonacci
- RSI
- Gann
- ADXR
- Stochastics
- Volume
- Triangles
- Futures
- Cycles
- Volatility
- ZIGZAG
- MESA
- Retracement
- Aroon
INDICATORS LIST
LIST OF TOPICS
PRINT THIS ARTICLE
by Matt Blackman
On December 22, I wrote about a diamond bottom pattern that had formed on this software company's chart. It hasn't broken out yet but is threatening to do so.
Position: N/A
Matt Blackman
Matt Blackman is a full-time technical and financial writer and trader. He produces corporate and financial newsletters, and assists clients in getting published in the mainstream media. He is the host of TradeSystemGuru.com. Matt has earned the Chartered Market Technician (CMT) designation. Find out what stocks and futures Matt is watching on Twitter at www.twitter.com/RatioTrade
PRINT THIS ARTICLE
FLAGS AND PENNANTS
Tibco Bullish Flag 'A Hoisting!'
01/05/04 08:14:53 AMby Matt Blackman
On December 22, I wrote about a diamond bottom pattern that had formed on this software company's chart. It hasn't broken out yet but is threatening to do so.
Position: N/A
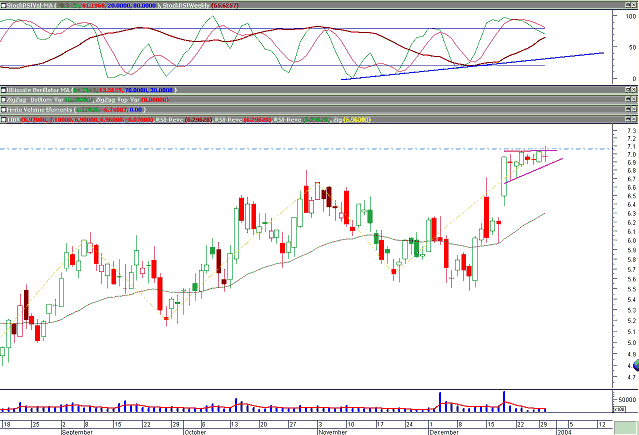
| In my article Tibco Software Diamond Bottom, I discussed a bullish diamond bottom formation that had formed and suggested watching it for signs of a breakout on volume. Another look reveals a bullish consolidation flag pattern forming, demonstrating that traders and investors appear to have been accumulating during the Christmas season. |
| The Santa Claus rally that everyone was hoping for materialized between Christmas and New Year's Day and there is every indication that, barring some unforeseen negative geopolitical or economic event, the good times should continue into January, and with a little help, Tibco should be joining the party. One caveat, however. It is not a good idea to jump aboard until the top flag resistance line is broken on volume close to the 8 million mark set on the last gap on December 18. Volume exceeding this amount on an upside break would be clear evidence that the consolidation is over and the elevator is going up again. Next stop: $7.60. |

|
| Figure 1: Daily chart of Tibco Software (TIBX-OTC) showing the recent bullish flag pattern forming in the final days of 2003. Also note the bullish divergence (blue line) on the stochasticRSI (upper window). Traders will be looking for a volume spike similar to the last gap on a breakout about $7.10. Also note the longer-term resistance line (dashed blue line) at $7.06. There is no further resistance until the $7.60 range. |
| Graphic provided by: MetaStock. |
| |
Matt Blackman is a full-time technical and financial writer and trader. He produces corporate and financial newsletters, and assists clients in getting published in the mainstream media. He is the host of TradeSystemGuru.com. Matt has earned the Chartered Market Technician (CMT) designation. Find out what stocks and futures Matt is watching on Twitter at www.twitter.com/RatioTrade
| Company: | TradeSystemGuru.com |
| Address: | Box 2589 |
| Garibaldi Highlands, BC Canada | |
| Phone # for sales: | 604-898-9069 |
| Fax: | 604-898-9069 |
| Website: | www.tradesystemguru.com |
| E-mail address: | indextradermb@gmail.com |
Traders' Resource Links | |
| TradeSystemGuru.com has not added any product or service information to TRADERS' RESOURCE. | |
Click here for more information about our publications!
Comments
Date: 01/06/04Rank: 3Comment:
Date: 01/06/04Rank: 2Comment: Looks like this was written about 5 trading days ago, not too useful after it has already happened.

Request Information From Our Sponsors
- StockCharts.com, Inc.
- Candle Patterns
- Candlestick Charting Explained
- Intermarket Technical Analysis
- John Murphy on Chart Analysis
- John Murphy's Chart Pattern Recognition
- John Murphy's Market Message
- MurphyExplainsMarketAnalysis-Intermarket Analysis
- MurphyExplainsMarketAnalysis-Visual Analysis
- StockCharts.com
- Technical Analysis of the Financial Markets
- The Visual Investor
- VectorVest, Inc.
- Executive Premier Workshop
- One-Day Options Course
- OptionsPro
- Retirement Income Workshop
- Sure-Fire Trading Systems (VectorVest, Inc.)
- Trading as a Business Workshop
- VectorVest 7 EOD
- VectorVest 7 RealTime/IntraDay
- VectorVest AutoTester
- VectorVest Educational Services
- VectorVest OnLine
- VectorVest Options Analyzer
- VectorVest ProGraphics v6.0
- VectorVest ProTrader 7
- VectorVest RealTime Derby Tool
- VectorVest Simulator
- VectorVest Variator
- VectorVest Watchdog
