

HOT TOPICS LIST
- MACD
- Fibonacci
- RSI
- Gann
- ADXR
- Stochastics
- Volume
- Triangles
- Futures
- Cycles
- Volatility
- ZIGZAG
- MESA
- Retracement
- Aroon
INDICATORS LIST
LIST OF TOPICS
PRINT THIS ARTICLE
by Matt Blackman
This stock was a high flyer in 2000 but if this pattern is any indication, there are better days on the horizon again for the company.
Position: N/A
Matt Blackman
Matt Blackman is a full-time technical and financial writer and trader. He produces corporate and financial newsletters, and assists clients in getting published in the mainstream media. He is the host of TradeSystemGuru.com. Matt has earned the Chartered Market Technician (CMT) designation. Find out what stocks and futures Matt is watching on Twitter at www.twitter.com/RatioTrade
PRINT THIS ARTICLE
CHART ANALYSIS
Tibco Software Diamond Bottom
12/22/03 07:56:57 AMby Matt Blackman
This stock was a high flyer in 2000 but if this pattern is any indication, there are better days on the horizon again for the company.
Position: N/A
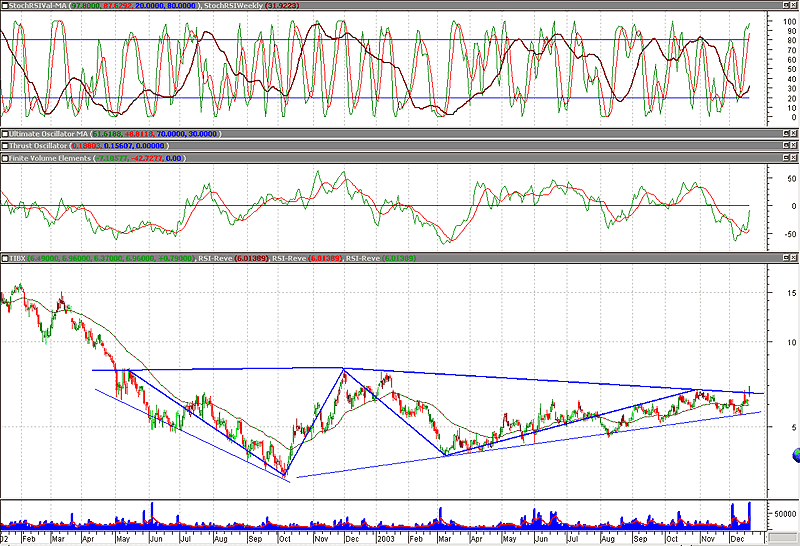
| After hitting a high of $147 on March 9, 2000, Tibco Software (TIBX-OTC) experienced a sickening roller coaster ride that took it down into low single digits. It hit a low of $3.28 in October 2002 and has since been slowly but surely building a solid base. It recently completed the diamond bottom, breaking out of a topside diamond neckline on its highest volume in more than two years. |
| I received this heads up from Recognia.com, a wholesale provider of technical analysis data that supplies chart pattern alerts to brokerage companies for redistribution to their customers. |
|
| Figure 1 � Daily chart of Tibco Software showing a diamond bottom pattern that has been in the making for more than 400 days. It recently broke above its neckline on yearly high volume, which is very bullish. If the neckline holds, expect the stock to continue its upward march. The daily stochastic RSI is in overbought territory but the weekly stochasticRSI is giving a buy (upper window). The finite volume elements indicator (middle window) gave a buy signal on December 11-03. Signal by Recognia.com |
| Graphic provided by: MetaStock. |
| |
| From a market perspective, technology stocks have been heading lower in the last few trading periods making the purchase of a software company somewhat more risky as it is counter to the overall move of the Nasdaq. I would prefer to see the sector moving up before I went long. Fundamentally, Tibco revenues have been stable over the last five quarters and earnings have remained positive in the last year. Profits margins jumped from a loss of 35% for the year ending November 2002 to 4% for the quarter ending August 03. A price/earnings ratio of 185 is a concern especially considering it is more than 560% of the industry average. The company reported fiscal year earnings of $0.03 per share on December 17. Analysts had been expecting $0.06 according to the Wall Street Journal but the stock still jumped more than 7% the next day. |
Matt Blackman is a full-time technical and financial writer and trader. He produces corporate and financial newsletters, and assists clients in getting published in the mainstream media. He is the host of TradeSystemGuru.com. Matt has earned the Chartered Market Technician (CMT) designation. Find out what stocks and futures Matt is watching on Twitter at www.twitter.com/RatioTrade
| Company: | TradeSystemGuru.com |
| Address: | Box 2589 |
| Garibaldi Highlands, BC Canada | |
| Phone # for sales: | 604-898-9069 |
| Fax: | 604-898-9069 |
| Website: | www.tradesystemguru.com |
| E-mail address: | indextradermb@gmail.com |
Traders' Resource Links | |
| TradeSystemGuru.com has not added any product or service information to TRADERS' RESOURCE. | |
Click here for more information about our publications!
Comments
Date:�12/23/03Rank:�5Comment:�
Date:�12/26/03Rank:�5Comment:�

Request Information From Our Sponsors
- StockCharts.com, Inc.
- Candle Patterns
- Candlestick Charting Explained
- Intermarket Technical Analysis
- John Murphy on Chart Analysis
- John Murphy's Chart Pattern Recognition
- John Murphy's Market Message
- MurphyExplainsMarketAnalysis-Intermarket Analysis
- MurphyExplainsMarketAnalysis-Visual Analysis
- StockCharts.com
- Technical Analysis of the Financial Markets
- The Visual Investor
- VectorVest, Inc.
- Executive Premier Workshop
- One-Day Options Course
- OptionsPro
- Retirement Income Workshop
- Sure-Fire Trading Systems (VectorVest, Inc.)
- Trading as a Business Workshop
- VectorVest 7 EOD
- VectorVest 7 RealTime/IntraDay
- VectorVest AutoTester
- VectorVest Educational Services
- VectorVest OnLine
- VectorVest Options Analyzer
- VectorVest ProGraphics v6.0
- VectorVest ProTrader 7
- VectorVest RealTime Derby Tool
- VectorVest Simulator
- VectorVest Variator
- VectorVest Watchdog