HOT TOPICS LIST
- MACD
- Fibonacci
- RSI
- Gann
- ADXR
- Stochastics
- Volume
- Triangles
- Futures
- Cycles
- Volatility
- ZIGZAG
- MESA
- Retracement
- Aroon
INDICATORS LIST
LIST OF TOPICS
PRINT THIS ARTICLE
by Ashwani Gujral
If people thought the Internet stocks were dead and buried long ago, think again. Yahoo and Amazon are two stars rising from the rubble.
Position: N/A
Ashwani Gujral
He is founder of AGIP Securities Pvt. Ltd. which offers money management services, live chat rooms (during market hours) and independent technical analysis consultancy. The company has a big media presence from the likes of CNBC, NDTV Profit, and ZEE Business.
PRINT THIS ARTICLE
CONSOLID FORMATION
Yahoo Consolidates Before Moving On
12/29/03 11:05:55 AMby Ashwani Gujral
If people thought the Internet stocks were dead and buried long ago, think again. Yahoo and Amazon are two stars rising from the rubble.
Position: N/A
| Most industry leaders from the Internet era have consolidated and broken out. Yahoo seems to be one of the leaders of that recovery, having moved to the $40-45 area within a short period of time. |
| Sharp moves tend to happen as stocks break out from long consolidations, after which the stock again consolidates at higher levels before making a further, often similar sized move. Whether you call it a consolidation or continuation pattern is not important, rather, following a large move, this type of pattern offers a low risk entry into the trend. These consolidation patterns can come in various forms: penants, flags, wedges, triangles, head and shoulders consolidation patterns, to name a few. Consolidations occur as a trending stock runs out of momentum and stalls while gathering momentum for another run. |

|
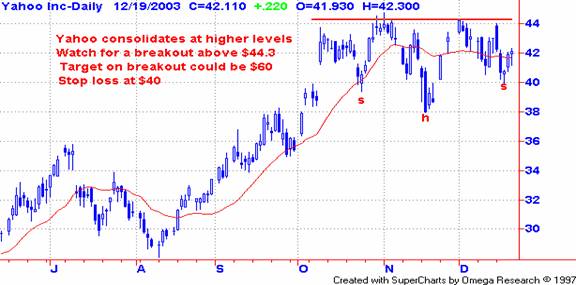
| Figure 1: Daily chart for Yahoo. |
| Graphic provided by: SuperCharts. |
| |
| Investors should be careful though that these consolidations are actually continuation patterns and not signs of distribution. This can be determined by tracking the volume figures. Most such consolidations occur at lower volumes than the previous rallies and subsequent breakouts. A low volume breakout is probably suspect and traders need to wait until the stock shows momentum and volumes to the upside. |
| During a consolidation the stock should not start falling on heavy volume. Traders should be wary if the stock starts showing lower bottoms at any stage, or starts breaking any crucial support levels. Another indicator that could alert to potential trouble is the 20-day simple moving average (SMA), which flattens out in these types of consolidations. It should not start falling under any circumstances. As the stock breaks out, the 200-day SMA should start moving up again. The lower end of the consolidation can be taken as the stop-loss for a long trade. |
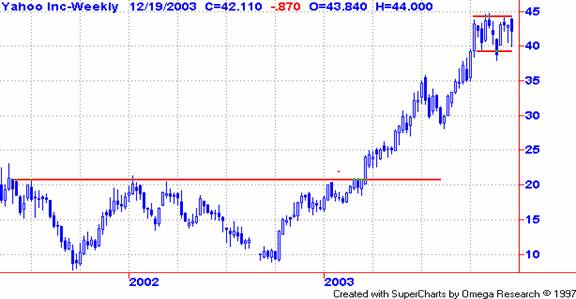
| Also care should be taken not to anticipate a breakout until it actually occurs with high volume. Until then the consolidation pattern has not been confirmed and downward movement of the stock would be more likely. Yahoo consolidated between $9 and $20 for about three years before breaking out in March 2003, making a nice move to $42. For the last several weeks Yahoo seems to be consolidating in the $40 to $45 area, getting ready to start another move. The daily chart is taking on the shape of head and shoulders continuation pattern that is likely to break out above $44.30. The target for the next move appears to be $60. A stop can be placed at $40. This trade has a risk reward of 3:1, which is great for any trade. A look at the weekly chart would again show a countertrend move in Yahoo.  Figure 2: Weekly chart for Yahoo. |
He is founder of AGIP Securities Pvt. Ltd. which offers money management services, live chat rooms (during market hours) and independent technical analysis consultancy. The company has a big media presence from the likes of CNBC, NDTV Profit, and ZEE Business.
| Title: | Chief mkt strategist |
| Company: | AGIP Securities |
| India | |
| Phone # for sales: | 9871066337 |
| Website: | www.ashwanigujral.com |
| E-mail address: | contact@ashwanigujral.com |
Traders' Resource Links | |
| AGIP Securities has not added any product or service information to TRADERS' RESOURCE. | |
Click here for more information about our publications!
Comments
Date: 12/30/03Rank: 5Comment:
Date: 12/30/03Rank: 5Comment:

|

Request Information From Our Sponsors
- VectorVest, Inc.
- Executive Premier Workshop
- One-Day Options Course
- OptionsPro
- Retirement Income Workshop
- Sure-Fire Trading Systems (VectorVest, Inc.)
- Trading as a Business Workshop
- VectorVest 7 EOD
- VectorVest 7 RealTime/IntraDay
- VectorVest AutoTester
- VectorVest Educational Services
- VectorVest OnLine
- VectorVest Options Analyzer
- VectorVest ProGraphics v6.0
- VectorVest ProTrader 7
- VectorVest RealTime Derby Tool
- VectorVest Simulator
- VectorVest Variator
- VectorVest Watchdog
- StockCharts.com, Inc.
- Candle Patterns
- Candlestick Charting Explained
- Intermarket Technical Analysis
- John Murphy on Chart Analysis
- John Murphy's Chart Pattern Recognition
- John Murphy's Market Message
- MurphyExplainsMarketAnalysis-Intermarket Analysis
- MurphyExplainsMarketAnalysis-Visual Analysis
- StockCharts.com
- Technical Analysis of the Financial Markets
- The Visual Investor
