HOT TOPICS LIST
- MACD
- Fibonacci
- RSI
- Gann
- ADXR
- Stochastics
- Volume
- Triangles
- Futures
- Cycles
- Volatility
- ZIGZAG
- MESA
- Retracement
- Aroon
INDICATORS LIST
LIST OF TOPICS
PRINT THIS ARTICLE
by Andrew Hetherington
The medium-term prognostication for this equity will be to eventually reach the resistance area in the $6.50 area. Here's how to watch the chart for an advantageous entry point.
Position: N/A
Andrew Hetherington
Classic Dow Theorist who trades as a pure technician, using pattern recognition.
PRINT THIS ARTICLE
CHART ANALYSIS
Cambior (CBJ-T) Is Another Solid Gold Play
11/17/03 01:21:19 PMby Andrew Hetherington
The medium-term prognostication for this equity will be to eventually reach the resistance area in the $6.50 area. Here's how to watch the chart for an advantageous entry point.
Position: N/A
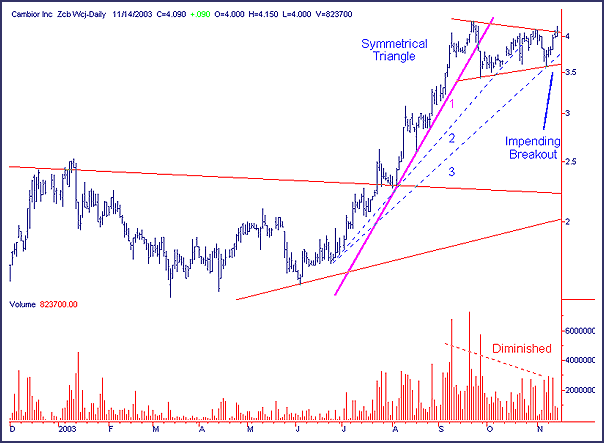
 Figure 1: Daily chart of Cambior. On the daily chart there is a 3-month symmetrical triangle with diminished volume on the creation of the pattern. Notice that interest in this equity has increased over the past five months. The volume is much higher than the previous months. This illustrates the much higher demand that will inevitably push prices upwards. The darker trendline, labeled 1 on the chart, gives early warning that the ride up is ready for a breather. When this line was broken, sideways or downward movement is expected. Naturally, the trend up will resume but only after taking a little time to pick up steam once again. |
| Trendline 1 was broken in the $3.90 area in September and has been consolidating between $3.42 - $4.11 since then. Some would argue there is no reason to sell your long position if the longer term uptrend is intact. This assumption can be a deadly mistake. The safest style of trading is to protect your downside risk by selling your long position and await reentry when another pattern has formed. If this doesn't happen, look for other opportunities. For Cambior, the impending break topside is expected in the $4.10 area and must be accompanied by an increase in volume in order to be trusted. |

|
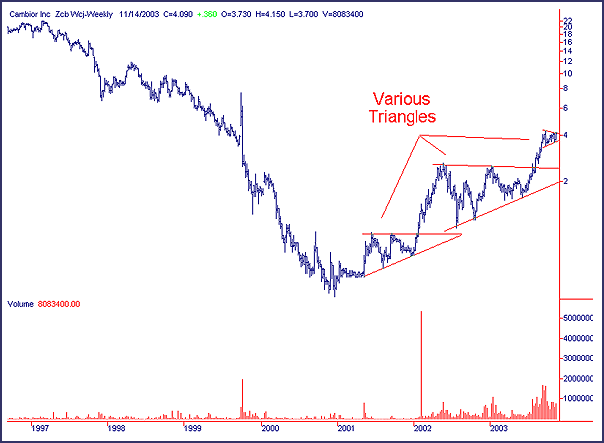
| Figure 2: Weekly chart of Cambior. |
| Graphic provided by: SuperCharts. |
| |
| On the weekly chart three consecutive triangles have formed. There was a bottom reversal-ascending triangle in 2001, and there are large and small symmetrical triangles currently forming. These all point to higher prices. The potential mistake is staying long no matter what trendlines are broken, and notice that the long-term trend is way down in the $2.50 area. Hence, the safest strategy is to sell your long position even though the long-term trend is intact. The medium-term prognostication for this equity after this breakout will be to eventually reach the resistance area in the $6.50 area. Naturally, gold prices and the Canadian dollar are factors to be considered. |
Classic Dow Theorist who trades as a pure technician, using pattern recognition.
| Toronto, Canada |
Click here for more information about our publications!
Comments
Date: 11/18/03Rank: 5Comment:

Request Information From Our Sponsors
- StockCharts.com, Inc.
- Candle Patterns
- Candlestick Charting Explained
- Intermarket Technical Analysis
- John Murphy on Chart Analysis
- John Murphy's Chart Pattern Recognition
- John Murphy's Market Message
- MurphyExplainsMarketAnalysis-Intermarket Analysis
- MurphyExplainsMarketAnalysis-Visual Analysis
- StockCharts.com
- Technical Analysis of the Financial Markets
- The Visual Investor
- VectorVest, Inc.
- Executive Premier Workshop
- One-Day Options Course
- OptionsPro
- Retirement Income Workshop
- Sure-Fire Trading Systems (VectorVest, Inc.)
- Trading as a Business Workshop
- VectorVest 7 EOD
- VectorVest 7 RealTime/IntraDay
- VectorVest AutoTester
- VectorVest Educational Services
- VectorVest OnLine
- VectorVest Options Analyzer
- VectorVest ProGraphics v6.0
- VectorVest ProTrader 7
- VectorVest RealTime Derby Tool
- VectorVest Simulator
- VectorVest Variator
- VectorVest Watchdog
