HOT TOPICS LIST
- MACD
- Fibonacci
- RSI
- Gann
- ADXR
- Stochastics
- Volume
- Triangles
- Futures
- Cycles
- Volatility
- ZIGZAG
- MESA
- Retracement
- Aroon
INDICATORS LIST
LIST OF TOPICS
PRINT THIS ARTICLE
by Andrew Hetherington
Watch the volume as Thunder Energy completes an ascending triangle and double bottom formation.
Position: N/A
Andrew Hetherington
Classic Dow Theorist who trades as a pure technician, using pattern recognition.
PRINT THIS ARTICLE
CHART ANALYSIS
Thunder Energy (THY-T) In Toronto Has Broken Out
11/12/03 10:14:55 AMby Andrew Hetherington
Watch the volume as Thunder Energy completes an ascending triangle and double bottom formation.
Position: N/A
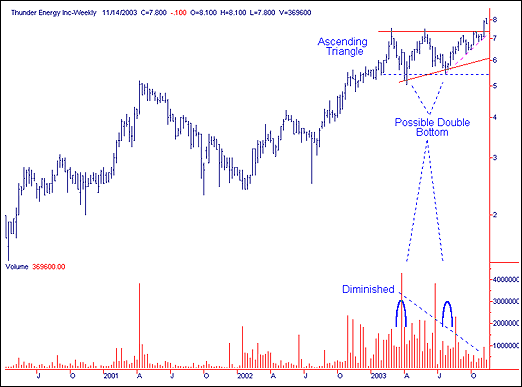
 Figure 1: Thunder Energy's weekly chart. Thunder Energy's weekly chart shows a 9-month ascending triangle. Although the volume is imperfect it clearly diminishes from left to right. There is also the suggestion of a double bottom. A double bottom formation should have higher cumulative volume on the first bottom compared to the second, which this one does. |
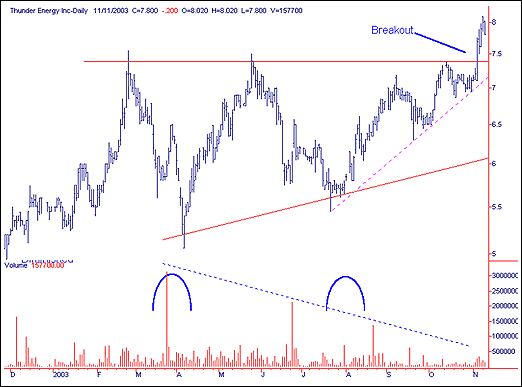
| There is confirmation of both patterns with the breakout in the $7.45 area. These breakouts must occur on increased activity as in this example. Although there is an increase in activity, ideally there should be higher volumes on the move upwards. The lack of huge volume on this breakout must send up a red flag. If you are in a long position, follow the purple performance line upwards and if it is broken then lock in your profits. Managing your downside risk in this situation may require you to use a stop-loss under this performance line. Move it upwards every few days to account for the slope of the line. If this suggestion is too liberal then use a tighter stop-loss in the $7.40 area. |

|
| Figure 2: Thunder Energy's daily chart. |
| Graphic provided by: SuperCharts. |
| |
| This equity will likely climb much higher after the expected throwback to the buy long position in the $7.40 area. However, if the volume does not continue to increase then caution is necessary even though there has been a breakout. In that case, watch the volume closely and keep your stop-loss tight. |
Classic Dow Theorist who trades as a pure technician, using pattern recognition.
| Toronto, Canada |
Click here for more information about our publications!
Comments
Date: 11/14/03Rank: 4Comment:

|

Request Information From Our Sponsors
- StockCharts.com, Inc.
- Candle Patterns
- Candlestick Charting Explained
- Intermarket Technical Analysis
- John Murphy on Chart Analysis
- John Murphy's Chart Pattern Recognition
- John Murphy's Market Message
- MurphyExplainsMarketAnalysis-Intermarket Analysis
- MurphyExplainsMarketAnalysis-Visual Analysis
- StockCharts.com
- Technical Analysis of the Financial Markets
- The Visual Investor
- VectorVest, Inc.
- Executive Premier Workshop
- One-Day Options Course
- OptionsPro
- Retirement Income Workshop
- Sure-Fire Trading Systems (VectorVest, Inc.)
- Trading as a Business Workshop
- VectorVest 7 EOD
- VectorVest 7 RealTime/IntraDay
- VectorVest AutoTester
- VectorVest Educational Services
- VectorVest OnLine
- VectorVest Options Analyzer
- VectorVest ProGraphics v6.0
- VectorVest ProTrader 7
- VectorVest RealTime Derby Tool
- VectorVest Simulator
- VectorVest Variator
- VectorVest Watchdog
