HOT TOPICS LIST
- MACD
- Fibonacci
- RSI
- Gann
- ADXR
- Stochastics
- Volume
- Triangles
- Futures
- Cycles
- Volatility
- ZIGZAG
- MESA
- Retracement
- Aroon
INDICATORS LIST
LIST OF TOPICS
PRINT THIS ARTICLE
by Koos van der Merwe
Interest rates are at an all time low and money has been flowing into Income Trusts to obtain a good yield. One of the Trusts I have been watching in the United States is the Scudder High Income Trust. It is a diversified, closed-end management investment company managed by a team of Zurich Scudder Investments, Inc. professionals. This tells you nothing, but when you look at the news release below, you can quickly see the company's value.
Position: Accumulate
Koos van der Merwe
Has been a technical analyst since 1969, and has worked as a futures and options trader with First Financial Futures in Johannesburg, South Africa.
PRINT THIS ARTICLE
CORRELATION ANALYSIS
SCUDDER HIGH INCOME TRUST.
11/06/03 09:03:55 AMby Koos van der Merwe
Interest rates are at an all time low and money has been flowing into Income Trusts to obtain a good yield. One of the Trusts I have been watching in the United States is the Scudder High Income Trust. It is a diversified, closed-end management investment company managed by a team of Zurich Scudder Investments, Inc. professionals. This tells you nothing, but when you look at the news release below, you can quickly see the company's value.
Position: Accumulate
NEW YORK, Oct. 9 /PR Newswire- First Call/ -- Scudder High Income Trust (NYSE: KHI) declared a monthly dividend of $0.053 per share, payable on October 31, 2003 to shareholders of record on October 20, 2003. The Ex-date is October 16, 2003. The previous monthly dividend was $0.053 per share. The Fund's initial offering was April 21, 1988. The current distribution rate represents a 9.68% annualized yield based on the closing market price of $6.57 on October 8, 2003, and an 11.14% annualized yield on a closing NAV of $5.71 on the same date. Note, it pays a 9.68% annual yield on a price of $6.57. The price on October 31, 2003 was $6.98, which means that the annualized yield would have dropped, but at, by my estimate, a yield of 9.11%, it is still outstanding. So with a yield as good as that, what is the risk? The risk is twofold.
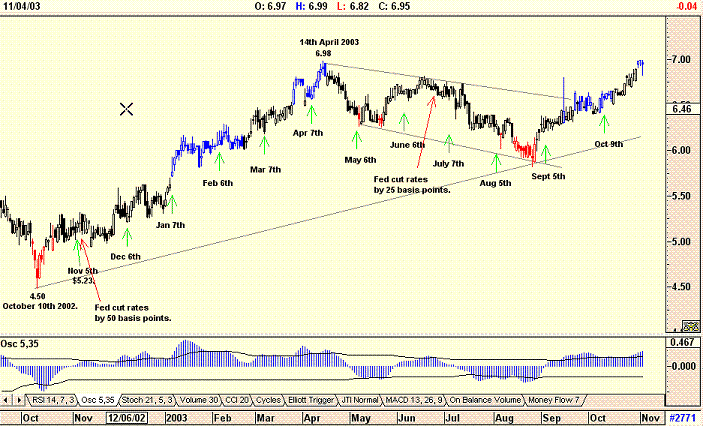
So now we have a look at the chart, to see if this can tell us anything. |
| The first thing we see is that on October 10, 2002 the share price hit a low of $4.50. Unfortunately I do not have a monthly distribution report for October, 2002, but on November 5, 2002 the company announced a monthly dividend of $0.053 per share, which offered a yield of 12.40%. On November 5, the price of the share was $5.23. The share appears to have sold off on the dividend, as the price immediately dropped to a low of $4.94 by November 13th. This is an old game: Buy the share a couple of weeks before a dividend is declared and then sell the day before it is declared. One can make a healthy capital gain. This appears to be the case here, as the share price rose $0.70 from October 10th to November 5th. |

|
| Scudder High Income Trust |
| Graphic provided by: AdvancedGET. |
| Graphic provided by: Metastock .... correlation chart with S&P500 Index. |
| |
| Holding the share however, would have produced better results as the chart shows you, because the price rose consistently till the April 14, 2003 when it reached a high of $6.98. Dividend traders would have done well in the process, selling when the dividend was declared, and buying back everytime a low was made although commissions paid would have eaten into their profits. In hindsight it is easy to identify the buy/sell pattern on the chart. The company has also been pretty consistent in its declared dividend dates. |
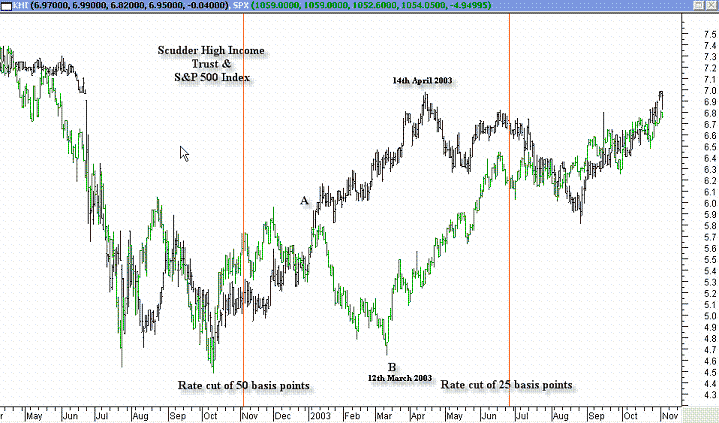
| So what other factor was there that would affect the share price? The obvious answer is Alan Greenspan, and speculation as to what the Federal Reserve has in mind as to reducing, maintaining or increasing interest rates. Yet when you place the actual rate movement of the Fed. on that chart, (see the second chart) it simply doesn't gel. On November 6, 2002 the Fed cut rates by 50 basis points, and on June 25, 2003 by 25 basis points. Now the stock moved up after the 50 basis point cut on November 6, which makes sense, but then started falling (A-B) while the index rose to a low on the March 12, 2003. When the index started falling on April 14, the Income Trust continued to rise almost anticipating the rate cut in June. So obviously it is not the cut in interest rates affecting the share price but possibly the anticipation of that cut. Furthermore, were it not for that fall from December 2, 2002 to March 12, 2003, (A-B) one can say that the Trust is correlating extremely well with the index. A look at a weekly chart is horrific, (not shown) where the price dropped from a high of $10.53 in February 1998 to the low of $4.50 in October 2002. The drop therefore started before the bubble melt down, as money must have moved from yield bearing stocks to growth stocks. I can only conclude that the Trust could be a leading indicator to the state of the U.S. economy, and the movement in the S&P index. Over the period the trust fell, from December 2, 2002 to March 12, 2003, while the S&P500 rose. I can only suggest that it could be reflecting investor uncertainty in the growth of the market and the economy. |
 Figure 2: Scudder High Income Trust vs. S&P500. Turning to pure technical analysis then for the answer, you can only assume that the Trust has just completed a rather lopsided flag, and that its projected target is approximately $8.31. (6.98 - 4 50 = 2 48 + 5.83 = 8.31). At current levels, ie. $6.98, the trust has met strong resistance and a break above this will see it rise possibly to the target suggested. In the meantime, enjoy the dividends and place tight stop losses. |
Has been a technical analyst since 1969, and has worked as a futures and options trader with First Financial Futures in Johannesburg, South Africa.
| Address: | 3256 West 24th Ave |
| Vancouver, BC | |
| Phone # for sales: | 6042634214 |
| E-mail address: | petroosp@gmail.com |
Click here for more information about our publications!
Comments
Date: 11/12/03Rank: 3Comment:

|

Request Information From Our Sponsors
- VectorVest, Inc.
- Executive Premier Workshop
- One-Day Options Course
- OptionsPro
- Retirement Income Workshop
- Sure-Fire Trading Systems (VectorVest, Inc.)
- Trading as a Business Workshop
- VectorVest 7 EOD
- VectorVest 7 RealTime/IntraDay
- VectorVest AutoTester
- VectorVest Educational Services
- VectorVest OnLine
- VectorVest Options Analyzer
- VectorVest ProGraphics v6.0
- VectorVest ProTrader 7
- VectorVest RealTime Derby Tool
- VectorVest Simulator
- VectorVest Variator
- VectorVest Watchdog
- StockCharts.com, Inc.
- Candle Patterns
- Candlestick Charting Explained
- Intermarket Technical Analysis
- John Murphy on Chart Analysis
- John Murphy's Chart Pattern Recognition
- John Murphy's Market Message
- MurphyExplainsMarketAnalysis-Intermarket Analysis
- MurphyExplainsMarketAnalysis-Visual Analysis
- StockCharts.com
- Technical Analysis of the Financial Markets
- The Visual Investor
