HOT TOPICS LIST
- MACD
- Fibonacci
- RSI
- Gann
- ADXR
- Stochastics
- Volume
- Triangles
- Futures
- Cycles
- Volatility
- ZIGZAG
- MESA
- Retracement
- Aroon
INDICATORS LIST
LIST OF TOPICS
PRINT THIS ARTICLE
by Arthur Hill
Amazon (AMZN) remains in a long-term uptrend, but remains overbought and a recent island reversal could mark the beginning of a significant trend change.
Position: Sell
Arthur Hill
Arthur Hill is currently editor of TDTrader.com, a website specializing in trading strategies, sector/industry specific breadth stats and overall technical analysis. He passed the Society of Technical Analysts (STA London) diploma exam with distinction is a Certified Financial Technician (CFTe). Prior to TD Trader, he was the Chief Technical Analyst for Stockcharts.com and the main contributor to the ChartSchool.
PRINT THIS ARTICLE
ISLAND REVERSAL
Amazon Leaves Them Stranded
10/30/03 10:15:02 AMby Arthur Hill
Amazon (AMZN) remains in a long-term uptrend, but remains overbought and a recent island reversal could mark the beginning of a significant trend change.
Position: Sell
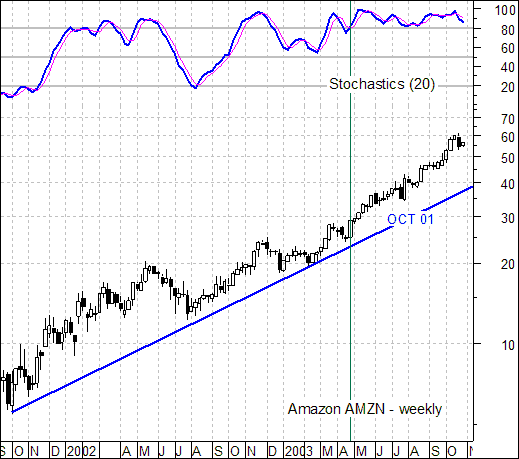
 Figure 1: Weekly chart of Amazon.com. The long-term trend is clearly bullish. Trendlines are one of the simplest and yet most effective analysis tools. The trend is clearly up as long as a security holds above a rising trendline. The trend is clearly down as long as a security holds below a falling trendline. AMZN remains comfortably above the trendline extending up from October 2001. |
| Even though the trend is firmly bullish, 20-period stochactics is trading in overbought territory (above 80). Overbought does not mean bearish, but implies that further upside may be limited. However, notice that stochastics moved above 80 in late April 2003 when the stock was trading below 30 (green line). The stock has since doubled while the indicator remained overbought. As long as the indicator remains above 80, a trend reversal is highly unlikely. Look for a move below 80 before thinking trend change. |

|
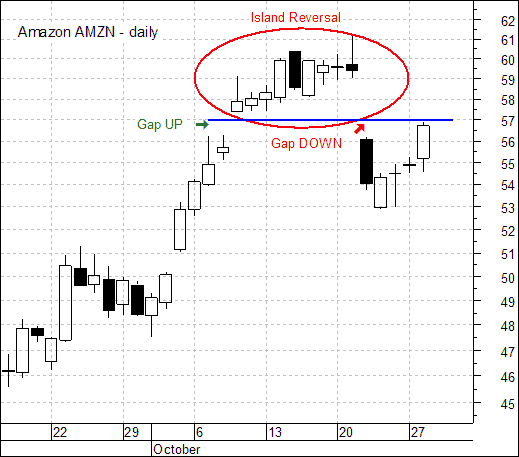
| Figure 2: Daily chart of Amazon.com. |
| Graphic provided by: MetaStock. |
| |
| A recent island reversal on the daily charts could signal trouble ahead (red oval). An island reversal forms with two gaps. The first gap is in the direction of the trend (green arrow), which was up in this case. After a few days of trading, the second gap forms in the opposite direction as the first gap (red arrow). The result is an island of trading with gaps on either side. All those who bought on the island are now trapped with losses. The second gap is now turning into resistance and should be considered bearish unless it is filled with an advance above 59. |
Arthur Hill is currently editor of TDTrader.com, a website specializing in trading strategies, sector/industry specific breadth stats and overall technical analysis. He passed the Society of Technical Analysts (STA London) diploma exam with distinction is a Certified Financial Technician (CFTe). Prior to TD Trader, he was the Chief Technical Analyst for Stockcharts.com and the main contributor to the ChartSchool.
| Title: | Editor |
| Company: | TDTrader.com |
| Address: | Willem Geetsstraat 17 |
| Mechelen, B2800 | |
| Phone # for sales: | 3215345465 |
| Website: | www.tdtrader.com |
| E-mail address: | arthurh@tdtrader.com |
Traders' Resource Links | |
| TDTrader.com has not added any product or service information to TRADERS' RESOURCE. | |
Click here for more information about our publications!
Comments
Date: 10/30/03Rank: 5Comment:

Request Information From Our Sponsors
- StockCharts.com, Inc.
- Candle Patterns
- Candlestick Charting Explained
- Intermarket Technical Analysis
- John Murphy on Chart Analysis
- John Murphy's Chart Pattern Recognition
- John Murphy's Market Message
- MurphyExplainsMarketAnalysis-Intermarket Analysis
- MurphyExplainsMarketAnalysis-Visual Analysis
- StockCharts.com
- Technical Analysis of the Financial Markets
- The Visual Investor
- VectorVest, Inc.
- Executive Premier Workshop
- One-Day Options Course
- OptionsPro
- Retirement Income Workshop
- Sure-Fire Trading Systems (VectorVest, Inc.)
- Trading as a Business Workshop
- VectorVest 7 EOD
- VectorVest 7 RealTime/IntraDay
- VectorVest AutoTester
- VectorVest Educational Services
- VectorVest OnLine
- VectorVest Options Analyzer
- VectorVest ProGraphics v6.0
- VectorVest ProTrader 7
- VectorVest RealTime Derby Tool
- VectorVest Simulator
- VectorVest Variator
- VectorVest Watchdog
